Download

1 / 66
660 likes | 669 Views
algebra 1<br>middle school & high school math

E N D
sausage pizza day! 10.10.22 Pick up a warm-up. Complete. Agenda: • Warm-up • Notes: Correlation Coefficient • Practice Pencil, Notebook, Chromebook
Warm-up NAME______________________________ DATE___________________PD_________
Warm-up NAME______________________________ DATE___________________PD_________
Warm-up NAME______________________________ DATE___________________PD_________
Warm-up NAME______________________________ DATE___________________PD_________
Scatter Plots and Lines of Best Fit Day 1 - Correlations
Scatter Plots and Lines of Best Fit I can: • identify the correlation of a scatter plot.
Describe this graph in a sentence. Review from 7th Grade:
As the temperatures increase, the sales increase. Review from 7th Grade:
What type of “sales” might this be representing? Review from 7th Grade:
Sales might represent ice cream, snowballs, bathing suits, fans, air conditioners, etc. Review from 7th Grade:
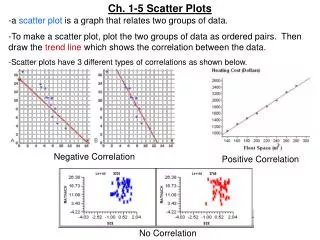
Scatter Plots and Lines of Best Fit Scatter Plot: A scatter plot is a graph of plotted points that shows a relationship between two sets of data.
Click here to watch a tutorial about scatter plots and correlations. Notes - Scatter Plots and Lines of Best Fit
Notes - Scatter Plots and Lines of Best Fit A perfect correlation is a straight line.
As x increases, y also increases. Notes - Scatter Plots and Lines of Best Fit
As x increases, y decreases. Notes - Scatter Plots and Lines of Best Fit
The data shows no relationship. Notes - Scatter Plots and Lines of Best Fit
Write this definition in your spiral!!! Notes - Scatter Plots and Lines of Best Fit
Write this definition in your spiral!!! Notes - Scatter Plots and Lines of Best Fit
Write this definition in your spiral!!! We will use technology to calculate the correlation coefficient. Notes - Scatter Plots and Lines of Best Fit
Perfect Negative Correlation The lowest possible correlation value is -1. This occurs when the data has a negative association and the points are in a straight line.
Strong Negative Correlation This occurs when the data has a negative association and the points are generally gathered close to a line.
Weak Negative Correlation This occurs when the data has a negative association and the points are not generally gathered close to a line.
exactly -1 closer to -1 farther from -1
Weak Positive Correlation This occurs when the data has a positive association and the points are not generally gathered close to a line.
Strong Positive Correlation This occurs when the data has a positive association and the points are generally gathered close to a line.
Perfect Positive Correlation The highest possible correlation value is +1. This occurs when the data has a positive association and the points are in a straight line.
closer to +1 exactly +1 farther from +1
No Correlation This occurs when the data has neither a positive nor a negative correlation. The correlation coefficient will be zero.
Summary Notes - Scatter Plots and Lines of Best Fit
Strong positive Strong Negative Weak Positive Weak Negative No Relationship Place the circle the type of correlation.
Strong positive Strong Negative Weak Positive Weak Negative No Relationship Place the circle the type of correlation.
Strong positive Strong Negative Weak Positive Weak Negative No Relationship Place the circle the type of correlation.
Strong positive Strong Negative Weak Positive Weak Negative No Relationship Place the circle the type of correlation.
Strong positive Strong Negative Weak Positive Weak Negative No Relationship Place the circle the type of correlation.
Strong positive Strong Negative Weak Positive Weak Negative No Relationship Place the circle the type of correlation.
Strong positive Strong Negative Weak Positive Weak Negative No Relationship Place the circle the type of correlation.
Strong positive Strong Negative Weak Positive Weak Negative No Relationship Place the circle the type of correlation.