Download
1 / 25
250 likes | 390 Views
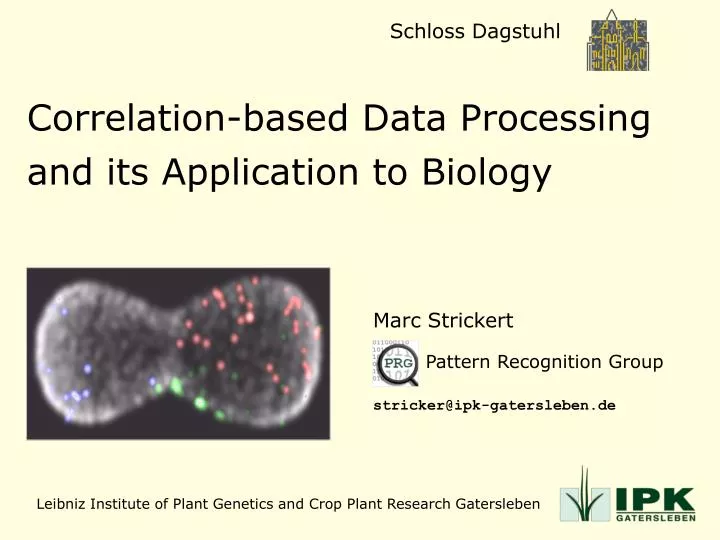
Schloss Dagstuhl. Correlation-based Data Processing and its Application to Biology. Marc Strickert. Pattern Recognition Group. stricker@ipk-gatersleben.de. Osnabrück, 14. Januar 2005. Leibniz Institute of Plant Genetics and Crop Plant Research Gatersleben. Goals. Attribute rating

E N D
Schloss Dagstuhl Correlation-based Data Processing and its Application to Biology Marc Strickert Pattern Recognition Group stricker@ipk-gatersleben.de Osnabrück, 14. Januar 2005 Leibniz Institute of Plant Genetics and Crop Plant Research Gatersleben
Goals • Attribute rating • Clustering • Classification • Visualization of biological data, exploiting properties of Pearson correlation.
Euclidean distances may be problematic d1= (x1-y1)2+ … + (x5-y5)2 1 identical despite of different shapes 2 d2= (x1-y1)2+ … + (x5-y5)2 [ John Lee and Michel Verleysen ]
Pearson correlation invariant to scaling and shifting amplitude vertical offset Up-regulated gene profiles raw data Euclideanview same profiles, aligned 'Pearson'view same correlations as above!
Derivatives of squared Euclidean and Pearson correlation Squared Euclidean: Pearson correlation:
Applications for derivative of similarity measure 1. Attribute rating (Variance analogon) 4. Visualization (High-Throughput MDS) 2. Clustering (Neural Gas for Correlation, NG-C) 3. Classification (GRLVQ-C)
Attribute rating Variance as double sum of derivatives Squared Euclidean distance =
High centroid reproducibility with NG-C 23 gene expression centroids, 10 independent runs NG-C Crisp final states. k-means Indeterminate final states.
Classification with relevance learning Adaptive Pearson correlation: For example used in Generalized Learning Vector Quantization with Correlation (GRLVQ-C)
Leukemia cancer data set: AML / ALL separation GRLVQ-C: Relevance factors top 10 gene ranking. 1 prototype per class + relevance learning. consistent with Golub et al.
Visualization of high-dimensional data d23 d13 d12 d13 d23 d12 High-dimensional data (constant source) Low-dimensional points (variable target) C' 2D 3D C B B' A' “embedding” A ! Gradient-based stochastic optimization HiT-MDS.
Maximize distance correlations: source ≈ reconstruction original inter-point distance matrix Adaptive parameters point coordinates reconstructed inter-point distance matrix Minimize embedding stress function using negative Fischer's Z':
Iterative gradient descent for stress function minimization | derivative of Fischer's Z' | for Euclidean spaces
High-Throughput Multi-Dimensional Scaling (HiT-MDS) , , and Input xiX Embedding xi X s dij dij r(dij , dij) Hit-MDS Algorithm Initialize X by random projection (or smarter). Calculate correlation r(X,X) once. Draw next Pattern xi. Minimize stress s to all xj: Dxik~ -∂s/∂xik. recalculate distances dij. adapt 1 2 3 r. 4 1 2 3 4
Applications of dimension reduction (visualization) 1. Gene space browser. 2. Macro-experiment grouping. 2 day 0 1 day 26
Embedding 12k Genes (14 time points) in 2D EUC COR SRC U I D FIT FIT FIT COR COR U EUC Euclidean distance COR Pearson correlation SRC Spearman rank cor. I D orig spline
Gene browser (4824 high-quality genes) 0 2 4 6 8 10 12 14 16 18 20 22 24 26 DAF … [ visualization: www.ggobi.org ]
Data processing challenges in biology Data Sets from • metabolite measurements (2D-gels, HPLC), • QTL LOD-score pattern compression, • DNA-sequence arrangement. Missing value imputation ( probabilistic models) Association studies ( common latent space, CCA) Rank-based data analysis ( distribution models) Faithful low-dimensional data representation Proximity data handling Common language: R / MATLAB / … ?
Thanks Pattern recognition group (IPK, headed by Udo Seiffert) Nese Sreenivasulu (IPK, Molecular Biology) Barbara Hammer (TU-Clausthal) Thomas Villmann (University of Leipzig) http://pgrc-16.ipk-gatersleben.de/~stricker/ http://hitmds.webhop.net/
Some References Strickert, M.; Sreenivasulu N.; Peterek, S.; Weschke W.; Mock, H.-P.; Seiffert, U. Unsupervised Feature Selection for Biomarker Identification in Chromatography and Gene Expression Data. In F. Schwenker and S. Marinai (Eds.), Artificial Neural Networks in Pattern Recognition, LNAI 4087, pp. 274-285, 2006. Strickert M.; Sreenivasulu N.; Seiffert, U. Sanger-driven MDSLocalize - A Comparative study for Genomic Data. In. M. Verleysen (Ed.), Proc.14th European Symp. Artificial Neural Networks (ESANN 2006), Bruges, Belgium. D-Side publishers Evere/Belgium, pp. 265-270, 2006. Strickert, M.; Seiffert, U.; Sreenivasulu, N.; Weschke, W.; Villmann, T.; Hammer, B. Generalized Relevance LVQ (GRLVQ) with Correlation Measures for Gene Expression Data. Neurocomputing 69(2006), pp. 651-659, Springer, 2006. Strickert M.; Sreenivasulu N.; Usadel, B.; Seiffert, U. Correlation-maximizing surrogate gene space for visual mining of gene expression patterns in developing barley endosperm tissue. To appear in BMC Bioinformatics, 2007. Strickert M.; Sreenivasulu N.; Seiffert, U. Browsing temporally regulated gene expressions in correlation-maximizing space. Accepted presentation at conference on Analysis of Compatibility Pathways (March 4-6, 2007).