Download
1 / 16
160 likes | 367 Views
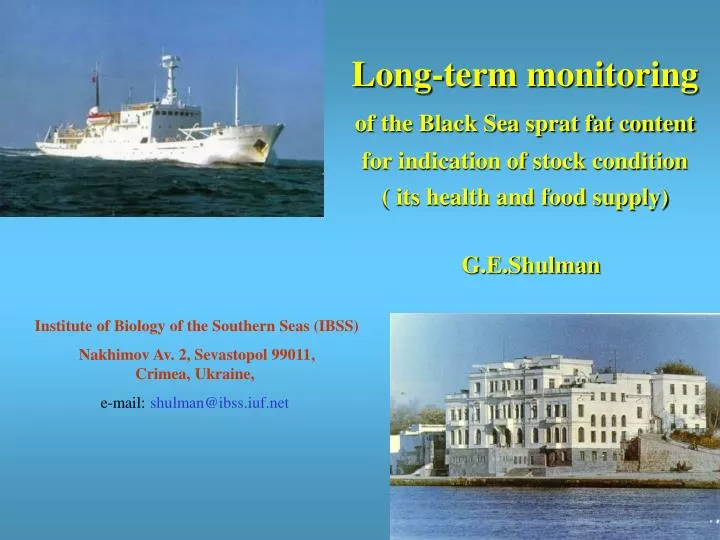
Long-term monitoring of the Black Sea sprat fat content for indication of stock condition ( its health and food supply). G.E.Shulman. Institute of Biology of the Southern Seas (IBSS) Nakhimov Av. 2, Sevastopol 99011, Crimea, Ukraine, e-mail: shulman@ibss.iuf.net. Main equations:.

E N D
Long-term monitoringof the Black Sea sprat fat contentfor indication of stock condition ( its health and food supply) G.E.Shulman Institute of Biology of the Southern Seas (IBSS) Nakhimov Av. 2, Sevastopol 99011, Crimea, Ukraine, e-mail: shulman@ibss.iuf.net
Main equations: Fp = Fc / Fd,(1) WHERE: Fp– FOOD PROVISION (OR SUPPLY), Fc– CONSUMED FOOD, Fd– DEMAND FOOD Fp = f (Ab , Ac1 ,…, Acn , T, L ,…, X1 ,…, Xn ) , (2) WHERE: Ab – BIOMASS OF FOOD ORGANISMS, Ac1 ,…, Acn – BIOMASS OF CONSUMERS, T – TEMPERATURE, L –LIGHT, X1 ,…, Xn – DICOUNTED FACTORS ΔW, ΔE = f (Fp ),(3) WHERE: ΔW – GROWTH INCREASE, ΔE– ENERGY ACCUMULATION
Sprat sampling locations in the Black Sea. 1: northwestern part of the sea (off the eastern Crimea); 2: western part of the sea (off Romania and Bulgaria); 3: eastern part of the sea (off Caucasus).
Long-term variability of fat content of the Black Sea sprat and main periods (bottom of figure) in its dynamics 16.0 14.0 12.0 10.0 8.0 1960 1965 1970 1975 1980 1985 1990 1995 2000
1800 1600 1400 1200 1000 Biomass, 103 tons 800 600 400 200 0 1960 1963 1966 1969 1972 1975 1978 1981 1984 1987 1990 1993 1996 1999 2002 Long-term variability of sprat stock biomass in the Black Sea (after Domashenko et al. 1985, Chashchin 1998);
Relationship between sprat fat content and stock biomass The correlation coefficient was estimated without including the data corresponding to 1986 and 1987
300 250 200 150 Zooplankton biomass, mg m –3 100 50 0 1990 1960 1962 1964 1966 1968 1970 1972 1974 1976 1978 1980 1982 1984 1986 1988 Long-term variability of food mesozooplankton biomass (without Noctiluca) in the northwestern part of the Black Sea (after Kovalev et al. 1998)
Long-term variability of total phytoplankton biomass in the Black Sea a) average annual biomass in NW part of the Black Sea (Mashtakova, Roukhiyanen, 1979)b) total Summer biomass in the Black Sea (Mikaelyan, 1996) a b
Relationship between sprat fat content and phytoplankton biomass in the northwestern Black Sea
Relationship between sprat fat content and phytoplankton biomass in the Black Sea
Sprat fat content dynamics compared to the 2nd principal component of the Black sea ecosystem variability Sprat fat content Second principal component PC2 (Daskalov, 2003)
List of species with similarity of catch value with Black Sea sprat fat content
Long-term dynamics of sprat fat content with recent data included
MAIN AUTHOR'S REFERENCE Shulman GE (1974) Life Cycles of Fish. Physiology and Biochemistry. Hulsted Press, John Wiley and Sons, New-York, 253 pp Shulman GE & Love RM (1999) The Biochemical Ecology of Marine Fishes. In: Advances in Marine Biology, v.36, Academic Press, London, 352 pp Shulman G.E, Nikolsky V.N, Yuneva T.V., Minyuk G.S., Shchepkin V.Ya., Shchepkina A.M, Ivleva E.V., Yunev O.A., Dobrovolov I.S., Bingel F., Kideys A.E. (2005) Fat content of Black Sea sprat as an indicator of fish food supply and ecosystem condition. Mar.Ecol.Prog.Ser., 293:201-212.
CONCLUSION (1) Data on fish fatness (as it has been demonstrated on the example of the Black Sea sprat) are effective indicator that characterize one of the most important features of stock condition: their food supply. (2) This indicator closely connects with other characteristics of stock condition (first of all with their biomass). (3) Due to fast determination, possibility of obtaining large number of field samples fish fatness can be used as indispensable parameter for monitoring of population and stock condition as well as pelagic ecosystem as whole.