Download
1 / 29
290 likes | 473 Views
Cosmology with Galaxy Clusters. Zolt á n Haiman. Princeton University. Collaborators: Joe Mohr (Illinois) Gil Holder (IAS) Wayne Hu (Chicago) Asantha Cooray (Caltech)

E N D
Cosmology with Galaxy Clusters Zoltán Haiman Princeton University Collaborators: Joe Mohr (Illinois) Gil Holder (IAS) Wayne Hu (Chicago) Asantha Cooray (Caltech) Licia Verde (Princeton) David Spergel (Princeton) } I. } II. } III. Dark Energy Workshop, Chicago, 14 December 2001
Outline of Talk • Cosmological Sensitivity of Cluster Surveys what is driving the constraints? • Beyond Number Counts what can we learn from dN/dM, P(k), and scaling laws
Introduction Era of “Precision Cosmology”: Parameters of standard cosmological model to be determined to high accuracy by CMB, Type Ia SNe, and structure formation (weak lensing, Ly forest) studies. Future Galaxy Cluster Surveys: Current samples of tens of clusters can be replaced by thousands of clusters with mass estimates in planned SZE and X-ray surveys Why Do We Need Yet Another Cosmological Probe? - Systematics are different (and possible to model!) - Degeneracies are independent of CMB, SNe, Galaxies - Unique exponential dependence
Power & Complementarity Z. Haiman / DUET Constraints using dN/dz of ~18,000 clusters in a wide angle X-ray survey (Don Lamb’s talk) Power comparable to: Planck measurements of CMB anisotropies 2,400 Type Ia SNe from SNAP • M to ~1% • to ~5% M
Galaxy Cluster Abundance Dependence on cosmological parameters # of clusters per unit area and z: comoving volume mass limit mass function mass function: Jenkins et al. 2001 Hubble volume N-body simulations in three cosmologies cf: Press-Schechter overall normalization power spectrum (8, M-r) growth function
Observables in Future Surveys SZ decrement: X-ray flux:
Predicting the Limiting Masses •Overall value of Mmin: determines expected yield and hence statistical power of the survey •Scaling with cosmology:effects sensitivity of the survey to variations in cosmic parameters •To make predictions, must assume: SZE: M-T relation (Bryan & Norman 1998) c (z) (top-hat collapse) (r) (NFW halo) X-ray: L-T relation (Arnaud & Evrard 1999; assuming it holds at all z)
Mass Limits and Dependence on w XR: flux=5x10-14 erg s-1 cm-2 SZ: 5 detection in mock SZA observations (hydro sim.) X-ray survey •X-ray surveys more sensitive to mass limit sensitivity amplified in the exponential tail of dN/dM w= -0.9 log(M/M⊙) w= -0.6 • w, Mnon-negligible sensitivity SZE survey •dependence weak •H0dependency: M ∝H0-1 redshift
Which Effect is Driving Constraints? • Fiducial CDM cosmology: M = 0.3 = 0.7 w = -1 (= ) H0 = 72 km s-1 Mpc-1 8 = 1 n = 1 • Examine sensitivity of dN/dz to five parameters M, w, , H0 , 8 by varying them individually. • Assume that we know local abundance N(z=0)
M=0.27 M=0.30 M=0.33 Sensitivity to M in SZE Survey M effects local abundance: N(z=0) ∝M → 8∝M-0.5 12 deg2 SZE survey dN/dz shape relatively insensitive to M Sensitivity driven by 8 change Haiman, Mohr & Holder 2001
Sensitivity to w in SZE Survey Haiman, Mohr & Holder 2001 12 deg2 SZE survey w=-1 w=-0.6 w=-0.2 dN/dz shape flattens with w Sensitivity driven by: volume (low-z) growth (high-z)
M=0.27 w=-1 M=0.30 w=-0.6 M=0.33 w=-0.2 Sensitivity to M,w in X-ray Survey 104 deg2 X-ray survey Haiman, Mohr & Holder 2001 w Sensitivity driven by Mmin M Sensitivity driven by 8 change
Sensitivities to , 8 ,H0 • Changes in and w similar change redshift when dark energy kicks in combination of volume and growth function • Changes in 8effect (only the) exponential term not degenerate with any other parameter •H0 dependence weak, only via curvature in P(k) dN/dz(>M/h) independent of H0 in power law limit P∝kn
When is Mass Limit Important? in the sense of driving the cosmology-sensitivity overwhelmed by 8-sensitivity if local abundance held fixed
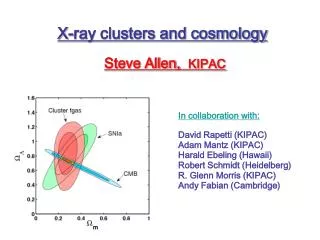
Constraints using ~200 clusters 3 2 vs 1 1% measurement of CMB peak location or 1% determination of dl(z=1) from SNe (M vs w) from 12 deg2 SZE survey Haiman, Mohr & Holder 2001 M w Clusters alone: ~4% accuracy on 0; ~40% constraint on w
Outline of Talk • Cosmological Sensitivity of Cluster Surveys what is driving the constraints? • Beyond Number Counts what can we learn from dN/dM, P(k), and scaling laws
Beyond Number Counts •Large surveys contain information in addition to total number and redshift distribution of clusters Shape of dN/dM Power Spectrum •Scaling relations Advantages of combining Sand Tx •Goal: complementary information provides an internal cross-check on systematic errors Degeneracies between “cosmology” and “cluster physics” different for each probe (e.g. for dN/dz and for S - Tx relation)
Shape of dN/dM work in progress Change in dN/dM under 10% change in M (0.3→0.33) Consider seven z-bins, readjust 8 2 significance for DUET sample of 20,000 clusters [encouraging, but must explore full degeneracy space]
Cluster Power Spectrum • Galaxy clusters highly biased: Large amplitude for PC(k) = b2 P(k) Cluster bias (in principle) calculable •Expected statistical errors on P(k) FKP (Feldman, Kaiser &Peacock 1994) “signal-to-noise” increased by b2 ~25 rivals that of SDSS spectroscopic sample
Cluster Power Spectrum - Accuracies ~6,000 clusters in each of three redshift bins P(k) determined to roughly the same accuracy in each z-bin Accuracies: k/k=0.1 → 7% k<0.2 → 2% NB: baryon “wiggles” are detectable at ~2 Z. Haiman / DUET
Effect on the Cluster Power Spectrum Pure P(k) “shape test” Neutrino Mass example m=0.2eV h2≈ 0.002 Courtesy W. Hu / DUET CMB anisotropies 3D power spectrum
(M vs ) from Cluster Power Spectrum Cooray, Hu & Haiman, in preparation Use 3D power spectrum DUET improves CMB neutrino limits: factor of ~10 over MAP factor of ~2 over Planck (because of degeneracy breaking) M h2 DUET+Planck Accuracy h2 ~ 0.002 h2
Angular Power Spectrum Cooray, Hu & Haiman, in preparation To apply geometric dA(z) test from physical scales of P(k)Cooray et al. 2001 Matter-radiation equality scale keq ∝ Mh2 “standard rod” when calibrated from CMB Mh2
(m vs w) from Angular Power Spectrum Cooray, Hu & Haiman, in preparation Using geometric dA(z) test from physical scales of P(k)Cooray et al. 2001 with ~12,000 clusters Projected 2D angular power spectrum in 5 redshift bins between 0<z<0.5. clusters break CMB degeneracies & shrink confidence regions M h2 w DUET+Planck: w ~ to 5%
Cluster Power Spectrum - Summary • High bias of galaxy clusters enables accurate measurement of cluster P(k): k/k=0.1 → P(k) to 7% at k=0.1 k<0.2 → P(<k) to 2% (rivals SDSS spectroscopic sample) •Expected statistical errors from DUET+Planck: h2 ~ 0.002 - shape test w ~ to 5% - dA(z) test •Enough “signal-to-noise” to consider 3-4 z- or M-bins: evolution of clustering peak bias theories / non-gaussianity
SZE and X-ray Synergy Using scaling relations, we can simultaneously Probe cosmology and test cluster structure S -TX scaling relation expected to have small scatter: (1) SZ signal robust (2) effect of cluster ages SZ decrement vs Temperature SZ decrement vs Angular size Verde, Haiman & Spergel 2001
Fundamental Plane: (S ,TX, ) Verde, Haiman & Spergel 2001 Plane shape sensitive to cosmology and cluster structure Tests the origin of scatter
(S ,TX) scaling relations + dN/dz test work in preparation Using a sample of ~200 clusters Different Mmin - 0 degeneracies can check on systematics
Conclusions • Clusters are a tool of “precision cosmology” a unique blend of cosmological tests, combining volume, growth function, and mass limits • Using dN/dz, P(k) complementary to other probes e.g.: (M,w) , (M, ), (M, ) planes vs CMB and SNe • Combining SZ and X-rays can tackle systematics solving for cosmology AND cluster parameters?