Download
1 / 7
70 likes | 105 Views
How Collabion Charts For Sharepoint Can Take You from Sharepoint Charting Nightmare To Nirvana

E N D
How Collabion Charts For Sharepoint Can Take You from Sharepoint Charting Nightmare To Nirvana
Seamless Compatibility 100% code-less charting and support for all on-prem versions of SharePoint including Foundation Servers.
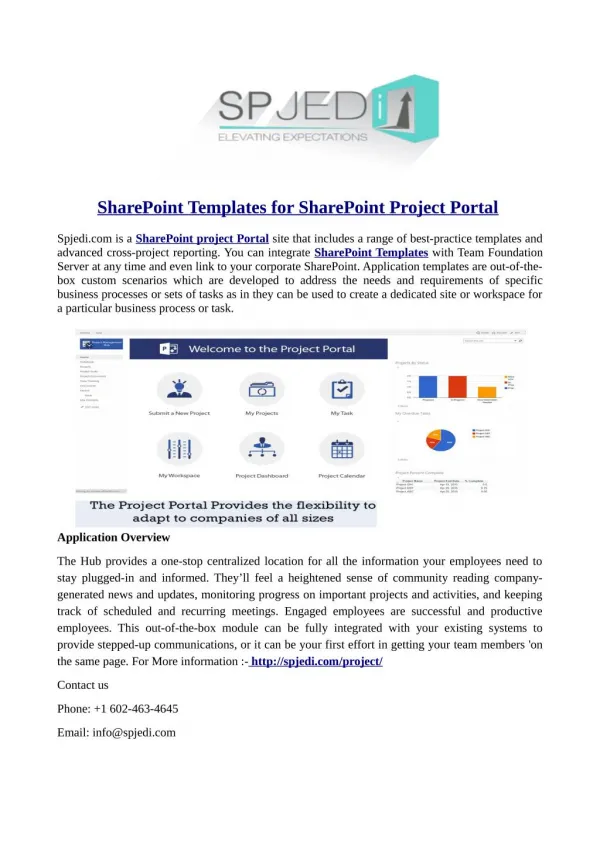
Different Data Sources Get data from SharePoint lists/views, Microsoft SQL Server, Oracle Database, Excel Workbooks, CSV, BCS/BDC and ODBC.
Advanced Data Processing View hierarchical data with features like drill down (up to n-th level), dynamic data filtering, grouping, and basic pivoting options. Connectivity with other web parts is also available.
Dozens Of Chart Types Choose the chart type that is perfect for your data, from 56 different options, including popular ones like column, bar, line, area, and pie. Special ones like Pareto, Marimekko, and several 3D varieties, are also available.
We Would Be Glad To Give A Tailor-made Demo Of Collabion to You • Extracting actionable insights from a deluge of SharePoint data can seem like an uphill climb. Take the easy route with Collabion Charts for SharePoint (CCSP). • Need a quick overview of how your business is performing, or want to dive deeper into data to visualize different sections? Our charts and custom dashboards let you do both, in less time and with greater accuracy than ever before! • Oh, and did we mention you don't need to write any code to do all that? • Use data from different sources, including SharePoint lists, SQL Server/Oracle databases, Microsoft Excel workbooks, CSV files, BDC, or any data source supported by ODBC • Use 56 different charts (including several 3D charts) and custom dashboards to visualize your data the right way, every time • Slice and dice data with filters and groups to visualize exactly what you need, or use drill down to extract specific types of insights • To schedule your personalized demo of Collabion Charts for SharePoint with the developers themselves, fill out the 'Request a Demo' form or call us at: +91 8582940372
We Are Located In Kolkata And Bangalore Bangalore Office InfoSoft Global Pvt Ltd. No. 12, First Floor, 17th A Main Road, 5th Block, Koramangala, Bangalore - 560095Karnataka, India Kolkata Office InfoSoft Global Pvt Ltd. Infinity Think Tank #1, 11th Floor Plot A3, Block GP, Sector V, Salt Lake City, Kolkata - 700091,West Bengal, India Visit: https://www.collabion.com/products/SharePoint-charts-graphs/