Download
1 / 6
60 likes | 182 Views
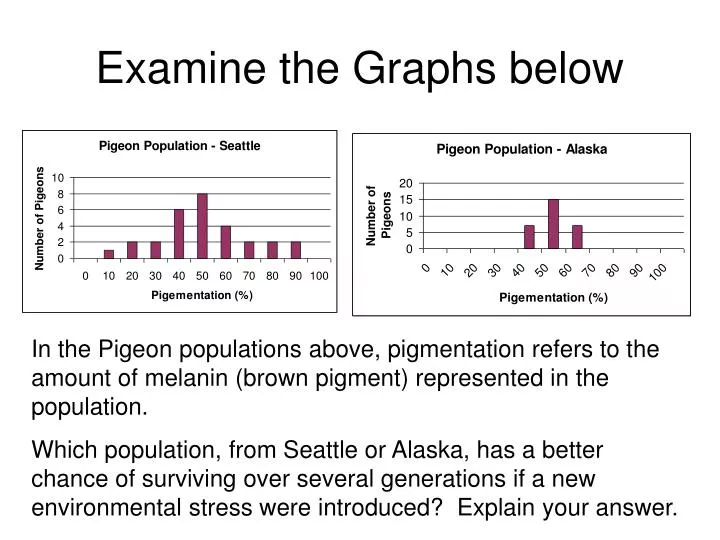
Examine the Graphs below. In the Pigeon populations above, pigmentation refers to the amount of melanin (brown pigment) represented in the population.

E N D
Examine the Graphs below In the Pigeon populations above, pigmentation refers to the amount of melanin (brown pigment) represented in the population. Which population, from Seattle or Alaska, has a better chance of surviving over several generations if a new environmental stress were introduced? Explain your answer.
Explain how some bacteria have evolved to become resistant to certain antibiotics (HINT: Be sure to address each of the 4 factors of natural selection).
Yeast Shark Toad Chicken Mouse Examine this Cladogram For the homologous protein Cytochrome C, there are 8 differences in amino acid sequence between the horse and the mouse. How many amino acid differences would you expect between the horse and the shark? Explain your answer. Horse
Sketch a Phylogenetic Tree • A tiger and lion share have 5 differences in their amino acid sequences for the protein Hemoglobin B. They share a common ancestor, which was cat-like. • A hyena and a wolf have 18 differences in their amino acid sequences for Hemoglobin B. They share a common ancestor that was dog-like. • Both cat-like creatures and dog-like creatures share a common ancestor (mammals with paws). Draw a phylogenetic tree that illustrates this data. Be sure you pay attention to the distances that animals are from their common ancestors.
Green sea turtle Logger head turtle Map turtle American alligator Lace monitor lizard • Which pair of species has the fewest differences in their amino acid sequences for myoglobin?
Green sea turtle Logger head turtle Map turtle American alligator Lace monitor lizard • How does the relationship between green sea turtles and loggerhead turtles compare to the relationship between alligators and monitor lizards?