Download
1 / 10
100 likes | 194 Views
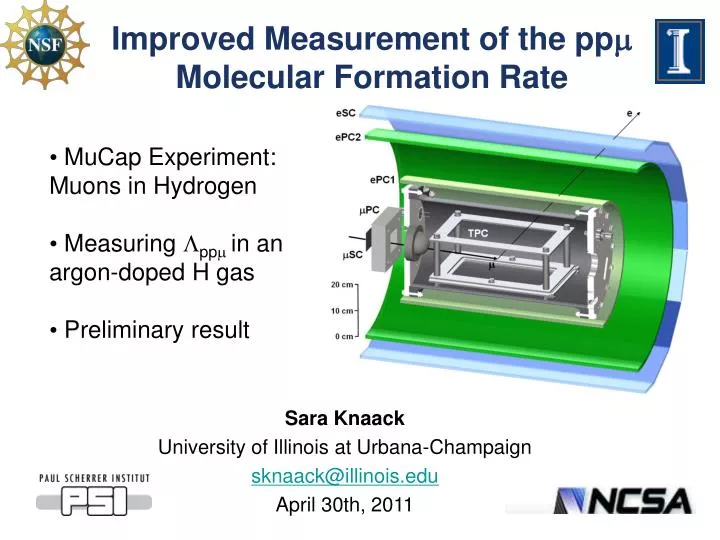
Improved Measurement of the pp Molecular Formation Rate. MuCap Experiment: Muons in Hydrogen Measuring pp in an argon-doped H gas Preliminary result. Sara Knaack University of Illinois at Urbana-Champaign sknaack@illinois.edu April 30th, 2011.

E N D
Improved Measurement of the pp Molecular Formation Rate • MuCap Experiment: Muons in Hydrogen • Measuring pp in an argon-doped H gas • Preliminary result Sara Knaack University of Illinois at Urbana-Champaign sknaack@illinois.edu April 30th, 2011
A low energy - stopping in a hydrogen gas enters a complex chain of atomic processes. • The - first cascades rapidly into the singlet state. • Captures onto the proton with rate S • or muon decay (-e-+e+) • The singlet state forms a molecular state at a rate pp. (, the density relative to liquid hydrogen) • The molecular state can evolve to a “para” (L=0) state. • Proton capture reduced in the molecular states. -p Triplet pp Ortho L=1 543 s-1 -p Singlet op pp= pp pp Para L=0 181 s-1 s=725 s-1 =0.45516 x10⁶ s-1
The MuCap detector observes decay electrons from muons stopped in a target gas. The hydrogen gas is both a target and active detection volume. e- - n detectors piE3 Beam line at the Paul Sherrer Institut 3D tracking w/o material in fiducial volume m- E m-p e- 2.0 kV/cm drift field ~5.4 kV on anodes of bottom wire chamber
A precision determination of s also determines the pseudoscalar coupling constant gp. - + pn + • Most precise experimental determination of gp • Test of chiral symmetries and low energy QCD • The electron time spectrum is described with a single lifetime; reduced due to capture. • MuCap measures S by comparing the - decay rate in hydrogen to the muon lifetime. • Recently measured to 1 ppm precision - q2 = -0.88m2 p n In leading order: Phys. Rev. Lett. 99, 032002 (2007)andPhys. Rev. Lett.106, 041803 (2011)
f = 0.01 (~10 bar gas) f = 1 (Liquid) Rel. Population Rel. Population Time after mp Formation Time after mp Formation Placing the hydrogen gas under 10 bar at room temperature minimizes the formation of molecular states and their effect on the S extraction. Relative population of -p, pp-o and pp-p states vs. time (0-20 s) These are still crucial systematics in our measurement, particularly pp. The improved precision of the final MuCap result requires an improved determination of pp.
The current uncertainty of pp • Historical variation of results and methods. • The systematic uncertainty is proportional to this uncertainty. • Systematic < 2 s-1 < 9 % relative precision Solid Gas Liquid • Bystritsky, et al. (1975) • Hydrogen gas doped to 10 ppm (atomic) with Xe. • An impurity gas introduces competing processes involving the muon. Soviet Physics JETP 44(5), 866 (1976) (Theory) and 43(4), 606 (1976)
Measurement uses Ar doping to introduce competing channel. • Argon attracts the - away from the - p atom and forms a -Ar atom. • The muon can capture onto the Ar nucleus, producing an observable n and recoiling nucleus. • We havepp, pAr, Ar dominating the kinetics, with well determined • These states have distinct, and statistically resolvable decay rates… pp pp=pp -p Singlet pAr = cArpAr 4.5 x10⁻² s-1 Ar Ar 1.3s-1 rpp rp + pp+pAr rAr +Ar +ArCl +n+ (Z4 S)
Ar introduces deformations to the e- time spectrum that are statistically resolvable, enabling an indirect determination of pp. cpp= pp/(pp+ pAr) cp= pAr Ar /((pp+ pAr)(pp+ pAr- Ar)) cAr= pAr/(pp+ pAr- Ar) • H gas with 18.5 0.5 ppm (atomic) of argon • 5x10⁸ e- events • background, rp, rpp and rAr (- sign)components • The statistics, coefficients and time scales help • Vary pp, pAr, and Arwith fixed • 2/NDF = 0.98 rpp rp + pp+pAr rAr +Ar
A preliminaryppresult ErrorTable For =0.0112(1): pp=2.007(62)Stat. ()Sys. s-1 • pp= 2.248(66)x10-2s-1 • e- analysis alone • Independent analysis of the n spectrum in progress • Systematics are not finalized Statistical error only Solid Gas Liquid
The effect of Ar on the time distribution of e- cpp= pp/(pp+ pAr) cp= pAr Ar /((pp+ pAr)(pp+ pAr- Ar)) cAr= pAr/(pp+ pAr- Ar) Electron spectrum with background, and rp, rpp and rAr (- sign)components of the spectrum. • The time distributions are described by differential equations… • Solutions are linear combinations of three “eigen” decay rates… • which are just those decay rates of the three states. • with coefficients of non-linear relations of the kinematic rates. rpp rp + pp+pAr rAr +pAr