Download
1 / 16
160 likes | 170 Views
Do 1 problem in which you do a 1-sample hypothesis test with statistics (mean). Veronica Coronado Sandra Gomez. In the population, IQ scores are normally distributed with a mean of 100. A charter school wants to know if their students have an IQ that is higher than the population mean.

E N D
Do 1 problem in which you do a 1-sample hypothesis test with statistics (mean). Veronica Coronado Sandra Gomez
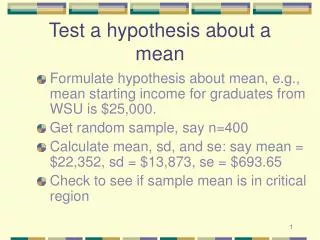
In the population, IQ scores are normally distributed with a mean of 100. A charter school wants to know if their students have an IQ that is higher than the population mean. They take a random sample of 15 students and find that they have a mean IQ of 109 with a standard deviation of 23 .
Ho: µ = 100 Ha: µ > 100 And our parameter is all the students in the charter school.
Now we have to check our conditions to ensure they meet limitations we are given. Random sample and Independence Normal Big population
Random sample and Independence, can be with or without replacement: Each observation is collected randomly from the population, and observations are independent of each other. The sample can be collected either with or without replacement
2. Normal Either the population distribution is normal or the sample size is large
3. Big population If the sample is collected without replacement then the population must be at least 10 times larger than the sample size.
Fail to reject the null hypothesis. With an alpha level of 5% and p-value about 7.5% there is not sufficient evidence that all charter school students have a higher IQ than the population mean score.
According to the National Association of Colleges and Employers, the average salary for a new college graduate • in 2013 was $45,327. A small academic program wants to know if the average salary of their graduates is different from $45,327. In a sample of 10 recent graduates, the average starting salary was $48,000 with a • standard deviation of $8,700. Assume the annual starting income for graduates of this program is approximately normally distributed
Ho: µ= 45,327 Ha: µ≠ 45,327 And our parameter is the average salary of all new college graduates of 2013.
Now we have to check our conditions to ensure they meet limitations we are given. Random sample and Independence Normal Big population
Hypothesis test results:μ : Mean of populationH0 : μ = 45327HA : μ ≠ 45327
Fail to reject the null hypothesis. With the alpha level 5% and a p-value about 35.6 %. There is not sufficient evidence to suggest the average salary of all new college graduates is different from the average of the National Association of Colleges and Employers.
1. What is the letter used to represent sample? 2. Once we’ve used Stat Crunch to analyze our data…what points must be made to justify a complete answer? 3. What’s the difference between a one tailed and a two tailed hypothesis?
4. Unless stated otherwise: what is the normal “rejection zone”? 5. When would we reject or fail to reject the null? 6. If there is no indicated “rejection zone, what is the default that we use.


![Statistics [1/2,3/2]](https://cdn2.slideserve.com/4297614/statistics-1-2-3-2-dt.jpg)