Download
1 / 27

E N D
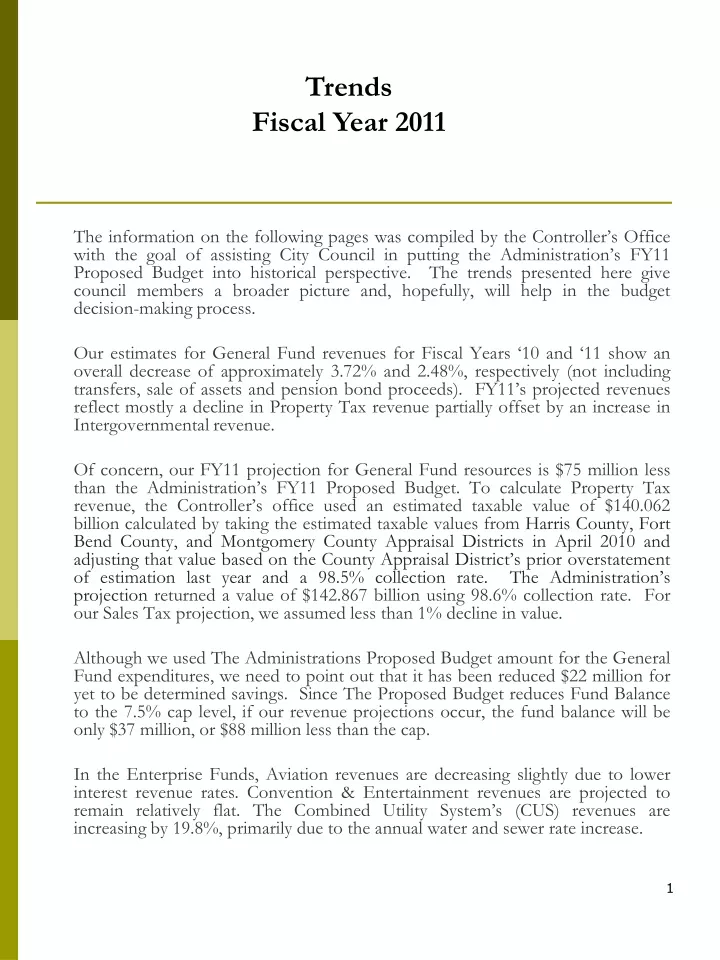
Trends Fiscal Year 2011 The information on the following pages was compiled by the Controller’s Office with the goal of assisting City Council in putting the Administration’s FY11 Proposed Budget into historical perspective. The trends presented here give council members a broader picture and, hopefully, will help in the budget decision-making process. Our estimates for General Fund revenues for Fiscal Years ‘10 and ‘11 show an overall decrease of approximately 3.72% and 2.48%, respectively (not including transfers, sale of assets and pension bond proceeds). FY11’s projected revenues reflect mostly a decline in Property Tax revenue partially offset by an increase in Intergovernmental revenue. Of concern, our FY11 projection for General Fund resources is $75 million less than the Administration’s FY11 Proposed Budget. To calculate Property Tax revenue, the Controller’s office used an estimated taxable value of $140.062 billion calculated by taking the estimated taxable values from Harris County, Fort Bend County, and Montgomery County Appraisal Districts in April 2010 and adjusting that value based on the County Appraisal District’s prior overstatement of estimation last year and a 98.5% collection rate. The Administration’s projection returned a value of $142.867 billion using 98.6% collection rate. For our Sales Tax projection, we assumed less than 1% decline in value. Although we used The Administrations Proposed Budget amount for the General Fund expenditures, we need to point out that it has been reduced $22 million for yet to be determined savings. Since The Proposed Budget reduces Fund Balance to the 7.5% cap level, if our revenue projections occur, the fund balance will be only $37 million, or $88 million less than the cap. In the Enterprise Funds, Aviation revenues are decreasing slightly due to lower interest revenue rates. Convention & Entertainment revenues are projected to remain relatively flat. The Combined Utility System’s (CUS) revenues are increasing by 19.8%, primarily due to the annual water and sewer rate increase.
Summary of Graphs The numbers on each page are from the following sources: 1. FY09 and prior years are actual results as reported in previous Comprehensive Annual Financial Reports (CAFR). 2. FY10 numbers are the Controller’s Office April Monthly Financial Operations Report (MFOR) estimates. 3. The FY11 General Fund revenues are the most current projections of the Controller’s Office. 4. Unless otherwise noted, all other FY11 numbers are from the Administration’s FY11 Proposed Budget.
General Fund Revenues (amounts expressed in thousands) [a] The “Percentage Change” column compares our FY11 projection to our FY10 estimate, while the “Difference” column compares our FY11 projection to the proposed budget. [b] Property Tax revenue is net of refunds and Tax Increment Reinvestment Zone (TIRZ) payments. The Controller’s FY11 projection for Property Tax revenues is based on the taxable values provided by Harris County on April 29, 2010. This amount was reduced an additional 2% to reflect the rate of overstatement of the prior years taxable values. The projection assumes an estimated $23 million in delinquent collections and an estimated $65 million in TIRZ payments. [c] Sales Tax revenue uses our FY10 Sales Tax revenue estimate plus Dr. Barton Smith’s April 2010 estimated growth rate of 2.69% for FY2011. This is then reduced by Dr. Barton Smith’s margin of error of 3%. [d] Intergovernmental revenue is expected to increase as a result of increased revenues from Metro. [e] The Administration expects to receive an additional $15 million by increasing miscellaneous fees to coincide with the costs of providing services. The Controller’s projection includes an increase in fees of one-third of the Administration’s Proposed Budget. [f] Due to the uncertainty that these sales will take place, and the value to be received, the Controller’s office anticipates that only half of the Administration’s budget will be received.
General Fund Revenues(amounts expressed in millions) FY11 General Fund revenue is projected to shrink by $43.6 million, or 2.48%, under our current FY10 estimate. The projected decrease consists mostly of reduced Property Tax revenue of $69 million, offset by a $22 million increase in anticipated revenue from Metro.
Property Tax Revenue(amounts expressed in thousands) Property Tax revenue is projected to be lower than the FY10 estimate by 7.72%. TIRZ payments, delinquent tax collections and rebates are expected to remain stable as compared to FY10. Our Property Tax revenue projection is based on a tax rate of 63.875 cents per $100 valuation and a collection rate of 96.5%.
Taxable Values Historical & Forecast (amounts expressed in billions) The Harris County, Fort Bend County, and Montgomery County Appraisal Districts (the Districts) provide expected taxable values. The actual taxable values for FY10 are above the preliminary value estimates provided at this time last year. Based on their projection for FY11, an increase in valuation of about 2.42% is anticipated. These values are based on the Districts’ preliminary projected values, dated April 29, 2010, and reduced 2% to reflect the over projection of the prior year.
Taxable Values By Property Type Historical & Forecast(amounts expressed in billions) Residential and commercial properties in the City of Houston make up 96% of the taxable values reported by the Districts.
Sales Taxes Revenue(amounts expressed in thousands) We project Sales Tax revenue to be approximately flat compared to FY10 Sales Tax receipts. This decrease is based on 2.69% estimated growth of Dr. Barton Smith’s April report plus an error rate reduction of 3%.
Property Tax Rate (Tax Rate per $100 Valuation) The FY11 number is a projection. The final rate will be established by a vote of council in the second quarter of FY11.
Total Franchise Revenues(amounts expressed in thousands) Franchise revenues are projected to decrease 2%. This is a result of an anticipated decrease in Telephone Franchise revenues offset by an increase in Electricity Franchise revenues. The Telephone Franchise decrease is based on an estimated 6% decline in the number of access lines. The Electricity Franchise revenue increase is based on a 1% increase in usage.
Municipal Courts Revenues(amounts expressedin thousands) Municipal Courts Fines and Forfeits is approximately flat for FY11. This number takes into account uncertainty with the new collection processes.
General FundExpenditures Budget(amounts expressed in millions) The General Fund expenditure budget is down by 1.2%, a decrease of $22 million over our FY10 estimated expenditures. The gap between Controller’s projected revenues and budgeted expenditures will require using $129 million from the Fund Balance to cover the operating deficit.
General Fund Expenditures Percent by Function for 2011
Cash vs. Fund Balance General Fund(amounts expressed in thousands) The Undesignated Fund Balance consists of both cash and non-cash items and includes receivables for Sales Tax and Franchise Fees. It also includes $20 million from the Rainy Day Fund which will become Undesignated within the General Fund in FY11 when paid back from the Ike Fund, and approved by Council. The Undesignated Fund Balance is expected to decrease by $91 million in FY10 and $109 million in FY11.
City Ordinance5% Fund Balance Requirement General Fund (amounts shown in Millions) City ordinance requires an Undesignated Reserve of 5% of the adopted budget less debt. An Undesignated Reserve of 7.5% is preferred. For FY11 we project a $88 million deficit under the 7.5% Fund Balance. This is due to a difference in revenue of $74 million and Fund Balance difference of $14 million.
Aviation Revenues & Expenses (amounts expressed in millions) Aviation is projecting revenues to decrease slightly due to declines in non-operating revenue, primarily related to a budgeted decrease in interest revenue for lower earnings on investments. Projected increases in expenses are based on anticipated increased spending for Other Services and Charges, Interfund Services and Personnel costs.
Aviation Revenues(amounts expressed in millions) FY11 revenues are expected to decrease 0.6%, or $2.7 million from the FY10 estimate, primarily related to a budgeted decrease in interest revenue for lower earnings on investments.
Aviation Expenses (amounts expressed in millions) Aviation expects an FY11 expense increase of approximately 7.3%, or $16.9 million over the FY10 estimate. Personnel costs are increasing $6.0 million, and Other Services are increasing $10.9 million. The FY11 Debt Service budget is increasing due to the start of debt service payments related to the 2009A bonds and lower entitlement grants applied toward debt service.
Convention & Entertainment Revenues & Expenses(amounts expressed in millions) Convention & Entertainment projects that FY11 total expenses will exceed revenues by $4.6 million, which is primarily attributable to the department’s “pay-as-you-go” funding philosophy for capital and non-recurring projects. Such FY11 projects include facility upgrades and major maintenance projects. The operating deficit is funded by a fund balance that retained the balance of record HOT revenues in FY08 and FY09 in anticipation of the need for these projects.
Convention & Entertainment Revenues (amounts expressed in millions) Convention & Entertainment total revenues are primarily generated from HOT taxes reported as Non-Operating revenues, followed by parking fees and facility rentals with related concession revenues reported as Operating revenues. Non-Operating and Operating revenues are projected to remain relatively flat in FY11 when compared to estimated FY10 revenues.
Convention & Entertainment Expenses (amounts expressed in millions) Convention & Entertainment is projecting an increase in expenses due to the department’s “pay-as-you-go” funding philosophy for capital and non-recurring projects. Such FY11 projects include facility upgrades and major maintenance projects. Debt service is relatively flat.
Combined Utility System Revenues and Expenses (amounts expressed in millions) City ordinance directs that remaining funds, after all expenses and other financial obligations are met (the System’s net revenues), are transferred to the CUS General Purpose Fund. The funds within the CUS General Purpose Fund are available to pay for any lawful System purpose and for drainage purposes, subject to certain restrictions. Due to the deficit, no funds will be available to transfer to the General Purpose Fund in FY10.
Combined Utility System Revenue (amounts expressed in millions) Operating Revenues for the Combined Utility System are projected to increase year-over-year due in part to an annual rate adjustment equal to the previous calendar year's Consumer Price Index for the area including Houston, Galveston and Brazoria Counties. The rate adjustments for Fiscal Years 2007, 2008, 2009 and 2010 are 3.5%, 2.8%, 5.1% and 0.3%, respectively. The increase in Fiscal Year 2011 reflects the recently approved rate increase of approximately 24%.
Combined Utility System Operating Expenses by Category (amounts expressed in millions) The CUS Operating and Maintenance expenses reflect changes to Energy Expense Components, Employment expenses, additional resources to accommodate new customers or additional regulatory compliance. Operating Transfers include the System's debt service payment obligations as well as the drainage expense and debt service funding obligations. These numbers are the Administration's projections, not numbers generated by the Controller's Office.
Parking Management Revenues and Expenses(amounts expressed in millions) The Parking Management Fund was established as an Enterprise Fund in FY08 for funding and managing all on-street parking related improvements, efficiency measures, and operational decisions for on-street and surface parking, primarily in the Central Business District. The FY11 revenue budget is expected to be approximately $936,290 higher than FY10 estimate, while expenditure estimates are expected to be approximately 3.7% lower than FY11 budget. The FY11 Proposed Budget will draw down the 1.8 million estimated beginning Fund Balance by approximately $1.7 million.
Parking Management Revenue (amounts expressed in millions) Revenues for the Parking Management Fund fluctuate year-over-year due to economic uncertainties and construction projects within the City’s central business district. FY11 Revenue is expected to be $936,380 higher than the FY10 projected $13,753,388 level. Approximately 93% of Parking Management’s FY11 Total Revenue Budget is comprised of paid Citations from citations from parking violations (51.8%), metered parking (32.6%) and surface parking (8.7%). The remainder is spread among eight other sources permit sales and related fees.
Parking ManagementExpenses(amounts expressed in millions) The decrease in total expenditures of $632,869 for the Parking Management Fund from its’ FY10 estimate to FY11 budget was primarily due to the additional inter fund transfer of $1.5 million as reflected in FY10 Debt and Inter fund accounts estimate. In FY10, a total of $8.5 million ($7.0 adopted and additional supplemental $1.5 million) was transferred to General Fund to support and assist for close of the fund expenditure to revenue gap.