Download
1 / 11
130 likes | 375 Views
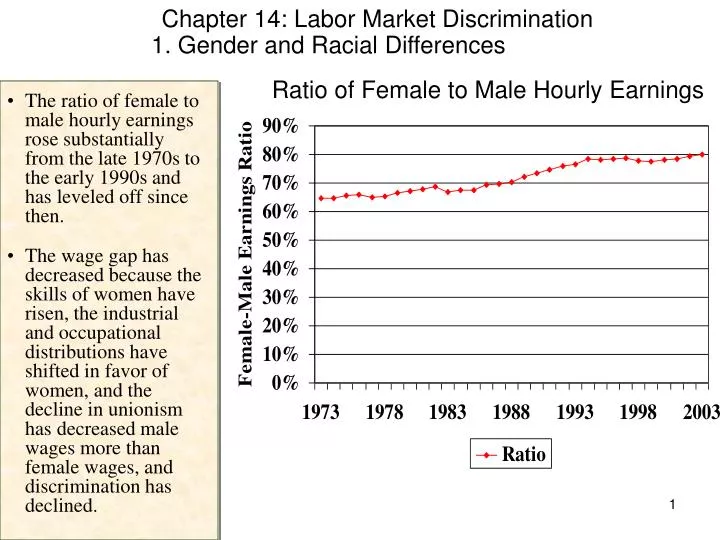
Chapter 14: Labor Market Discrimination. Ratio of Female to Male Hourly Earnings. The ratio of female to male hourly earnings rose substantially from the late 1970s to the early 1990s and has leveled off since then. 1. Gender and Racial Differences.

E N D
Chapter 14: Labor Market Discrimination Ratio of Female to Male Hourly Earnings • The ratio of female to male hourly earnings rose substantially from the late 1970s to the early 1990s and has leveled off since then. 1. Gender and Racial Differences • The wage gap has decreased because the skills of women have risen, the industrial and occupational distributions have shifted in favor of women, and the decline in unionism has decreased male wages more than female wages, and discrimination has declined.
Ratio of Black to White Weekly Earnings • The ratio of black to white hourly earnings has not changed much over the past 3 decades.
Unemployment Rate • The unemployment rate difference between white female and white males has narrowed over time. • Blacks have an unemployment rate that is consistently twice as great of those of whites.
Occupational Distribution by Gender, 2003 • Women are 47 percent of the employed labor force. • Women are over- represented in lower paying occupations such secretaries and elementary school teachers. • Women have made significant gains in recent decades into higher paying occupations.
Occupational Distribution by Race, 2003 • Blacks are 11 percent of the employed labor force. • Blacks are over- represented in lower paying occupations such janitors and cleaners and nursing aides.
Educational Attainment, 2003 • White males are likely to have a college education than females and blacks among persons 25 and older. • The quality of education received by blacks has generally been inferior that acquired by whites.
Earnings by Education, Race, and Sex, 2002 • Full-time women and black workers earn less than white males at each educational level. • Black males tend to earn more than black and white females.
Wb/ Ww Sb 1.00 0.8 Db Q Quantity of Black Workers Wage Discrimination in the Labor Market • The demand for black workers is formed by arraying employers from lowest for highest discrimination coefficients. • The horizontal portion of the demand curve is composed of non-discriminating employers. • The downward sloping portion consists of discriminating employers. • The quantity supply of black workers supplied rises as the black-white wage ratio rises. • The intersection of the supply and demand for black workers determines the black-white ratio and the number of black workers employed.
5. The Crowding Model: Occupational Segregation Wagerate Wagerate Wm We We Wf Df Dm Q1 Q2 Q2 Q1 Quantity of Labor Quantity of Labor Female Occs Male Occs Occupation Crowding • By crowding women into a narrow set of “female” occupations, men will receive high wage rates of Wm in male occupations, while women will receive low wage rates of Wf in female occupations. • Employers may practice job segregation if male (white) workers don’t like to work with female (black) workers.
Index of Occupational Segregation by Gender • The index of segregationshows the percentage of women (men) who would have to change occupations for women to be distributed among occupations in the same proportions as men. • The index of segregation by gender has fallen moderately over time.
Index of Occupational Segregation by Race • The index of segregation by race has fallen moderately over time.