Download
1 / 46
460 likes | 467 Views
Learn about parallax, a method to measure distances to stars, and how it is used to determine the luminosity and surface temperature of stars. Explore the Hertzsprung-Russell diagram and binary star systems to understand stellar masses.

E N D
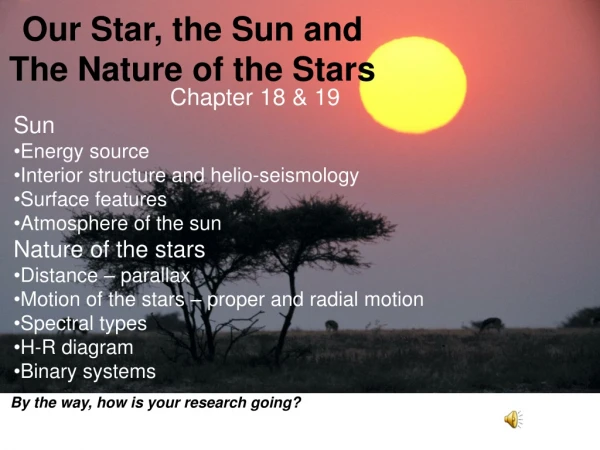
The Nature of the Stars Chapter 19
Parallax • Pictorially, it looks like this. • Pictorially, it looks like this.
Careful measurements of the parallaxes of starsreveal their distances • Distances to the nearer stars can be determined by parallax, the apparent shift of a star against the background stars observed as the Earth moves along its orbit • Parallax measurements made from orbit, above the blurring effects of the atmosphere, are much more accurate than those made with Earth-based telescopes • Stellar parallaxes can only be measured for stars within a few hundred parsecs
Space velocities • vt = 4.74 x μ x d • vt is the tangential velocity • μ is the star’s proper motion (in arcseconds per year) • d is the distance to the star (in parsecs) • v = SQRT (vt2 + vr2 ) allows the real space velocity to be found
If a star’s distance is known, its luminosity can bedetermined from its brightness • A star’s luminosity (total light output), apparent brightness, and distance from the Earth are related by the inverse-square law • If any two of these quantities are known, the third can be calculated
The Population of Stars • Stars of relatively low luminosity are more common than more luminous stars • Our own Sun is a rather average star of intermediate luminosity
Astronomers often use the magnitude scaleto denote brightness • The apparent magnitude scale is an alternative way to measure a star’s apparent brightness • The absolute magnitude of a star is the apparent magnitude it would have if viewed from a distance of 10 parsecs
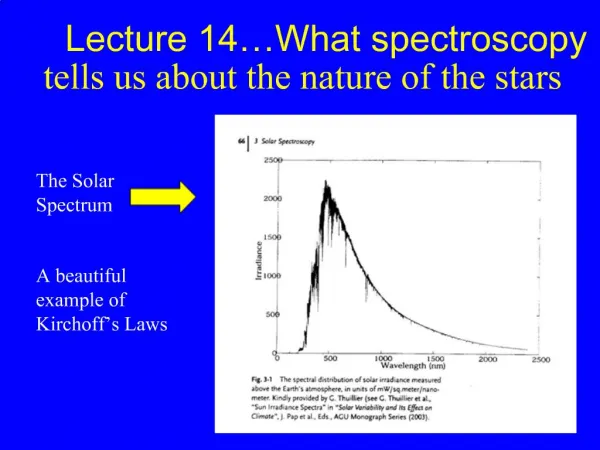
Photometry and Color Ratios • Photometry measures the apparent brightness of a star • The color ratios of a star are the ratios of brightness values obtained through different standard filters, such as the U, B, and V filters • These ratios are a measure of the star’s surface temperature
The spectra of stars reveal their chemicalcompositions as well as surface temperatures • Stars are classified into spectral types (subdivisions of the spectral classes O, B, A, F, G, K, and M), based on the major patterns of spectral lines in their spectra
The spectral class and type of a star is directly related to its surface temperature: O stars are the hottest and M stars are the coolest
Most brown dwarfs are in even cooler spectral classes called L and T • Unlike true stars, brown dwarfs are too small to sustain thermonuclear fusion
Relationship between a star’s luminosity, radius, and surface temperature Stars come in a wide variety of sizes
Magnitudes and Brightness (flux) • Consider 2 stars with apparent magnitudes, m, and brightness's, b. • m2 – m1 = 2.5 x log (b1 / b2) • Note if m2 – m1 = 1 then b1 / b2 = 2.512 • Further if m2 – m1 = 5 then b1 / b2 = 100
Distance Modulus • Consider a star with apparent magnitude, m, and absolute magnitude, M. Then • m – M = 5 x log (d) – 5 • Note that d is in parsecs • Further, if d = 10 parsecs then m – M = 5 x log (10) – 5 m – M = 5 – 5 = 0 • m – M is called the distance modulus
Hertzsprung-Russell (H-R) diagrams revealthe different kinds of stars • The H-R diagram is a graph plotting the absolute magnitudes of stars against their spectral types—or, equivalently, their luminosities against surface temperatures • The positions on the H-R diagram of most stars are along the main sequence, a band that extends from high luminosity and high surface temperature to low luminosity and low surface temperature
On the H-R diagram, giant and supergiant stars lie above the main sequence, while white dwarfs are below the main sequence
By carefully examining a star’s spectral lines, astronomers can determine whether that star is a main-sequence star, giant, supergiant, or white dwarf
Using the H-R diagram and the inverse square law, the star’s luminosity and distance can be found without measuring its stellar parallax
Binary Stars • Binary stars, in which two stars are held in orbit • around each other by their mutual gravitational attraction, are surprisingly common • Those that can be resolved into two distinct star images by an Earth-based telescope are called visual binaries • Each of the two stars in a binary system moves in an elliptical orbit about the center of mass of the system
Binary star systems provide crucial informationabout stellar masses • Binary stars are important because they allow astronomers to determine the masses of the two stars in a binary system • The masses can be computed from measurements of the orbital period and orbital dimensions of the system
Mass-Luminosity Relation for Main-Sequence Stars • Main sequence stars are stars like the Sun but with different masses • The mass-luminosity relation expresses a direct correlation between mass and luminosity for main-sequence stars • The greater the mass of a main-sequence star, the greater its luminosity (and also the greater its radius and surface temperature)
Spectroscopy makes it possible to study binarysystems in which the two stars are close together • Some binaries can be detected and analyzed, even though the system may be so distant or the two stars so close together that the two star images cannot be resolved • A spectrum binary appears to be a single star but has a spectrum with the absorption lines for two distinctly different spectral types • A spectroscopic binary has spectral lines that shift back and forth in wavelength • This is caused by the Doppler effect, as the orbits of the stars carry them first toward then away from the Earth
Light curves of eclipsing binaries provide detailedinformation about the two stars • An eclipsing binary is a system whose orbits are viewed nearly edge-on from the Earth, so that one star periodically eclipses the other • Detailed information about the stars in an eclipsing binary can be obtained from a study of the binary’s radial velocity curve and its light curve