Download
1 / 48
480 likes | 491 Views
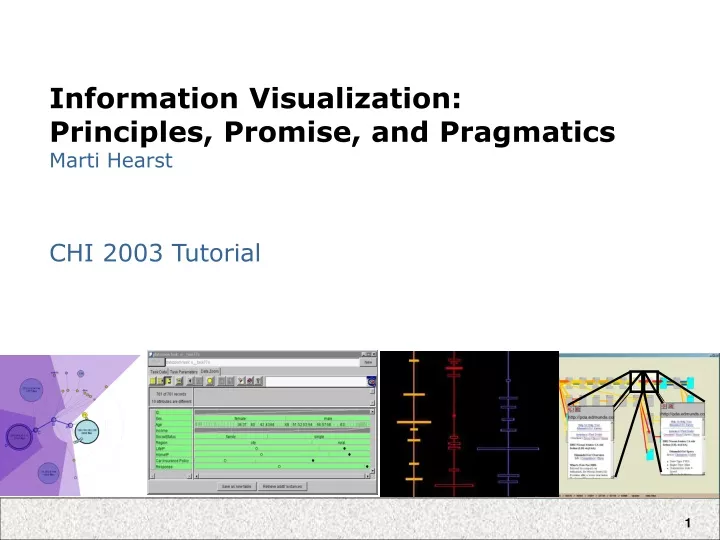
Information Visualization: Principles, Promise, and Pragmatics Marti Hearst. CHI 2003 Tutorial. Agenda. Introduction Visual Principles What Works? Visualization in Analysis & Problem Solving Visualizing Documents & Search Comparing Visualization Techniques Design Exercise Wrap-Up.

E N D
Information Visualization:Principles, Promise, and PragmaticsMarti Hearst CHI 2003 Tutorial
Agenda • Introduction • Visual Principles • What Works? • Visualization in Analysis & Problem Solving • Visualizing Documents & Search • Comparing Visualization Techniques • Design Exercise • Wrap-Up
Introduction • Goals of Information Visualization • Case Study: The Journey of the TreeMap • Key Questions
What is Information Visualization? Visualize: to form a mental image or vision of … Visualize: to imagine or remember as if actually seeing. American Heritage dictionary, Concise Oxford dictionary
What is Information Visualization? “Transformation of the symbolic into the geometric” (McCormick et al., 1987) “... finding the artificial memory that best supports our natural means of perception.'' (Bertin, 1983) The depiction of information using spatial or graphical representations, to facilitate comparison, pattern recognition, change detection, and other cognitive skills by making use of the visual system.
Information Visualization • Problem: • HUGE Datasets: How to understand them? • Solution • Take better advantage of human perceptual system • Convert information into a graphical representation. • Issues • How to convert abstract information into graphical form? • Do visualizations do a better job than other methods?
Visualization Success Stories Images from yahoo.com
The Power of Visualization 1. Start out going Southwest on ELLSWORTH AVE Towards BROADWAY by turning right. 2: Turn RIGHT onto BROADWAY. 3. Turn RIGHT onto QUINCY ST. 4. Turn LEFT onto CAMBRIDGE ST. 5. Turn SLIGHT RIGHT onto MASSACHUSETTS AVE. 6. Turn RIGHT onto RUSSELL ST. Image from mapquest.com
The Power of Visualization Line drawing tool by Maneesh Agrawala http://graphics.stanford.edu/~maneesh/
Visualization Success Story Mystery: what is causing a cholera epidemic in London in 1854?
Visualization Success Story Illustration of John Snow’s deduction that a cholera epidemic was caused by a bad water pump, circa 1854. Horizontal lines indicate location of deaths. From Visual Explanations by Edward Tufte, Graphics Press, 1997
Visualization Success Story Illustration of John Snow’s deduction that a cholera epidemic was caused by a bad water pump, circa 1854. Horizontal lines indicate location of deaths. From Visual Explanations by Edward Tufte, Graphics Press, 1997
Purposes of Information Visualization To help: Explore Calculate Communicate Decorate
Two Different Primary Goals:Two Different Types of Viz Explore/Calculate Analyze Reason about Information Communicate Explain Make Decisions Reason about Information
Goals of Information Visualization More specifically, visualization should: • Make large datasets coherent (Present huge amounts of information compactly) • Present information from various viewpoints • Present information at several levels of detail (from overviews to fine structure) • Support visual comparisons • Tell stories about the data
Why Visualization? Use the eye for pattern recognition; people are good at scanning recognizing remembering images Graphical elements facilitate comparisons via length shape orientation texture Animation shows changes across time Color helps make distinctions Aesthetics make the process appealing
The Need for Critical Analysis • We see many creative ideas, but they often fail in practice • The hard part: how to apply it judiciously • Inventors usually do not accurately predict how their invention will be used • This tutorial will emphasize • Getting past the coolness factor • Examining usability studies
Agenda • Introduction • Visual Principles • What Works? • Visualization in Analysis & Problem Solving • Visualizing Documents & Search • Comparing Visualization Techniques • Design Exercise • Wrap-Up
Visual Principles • Types of Graphs • Pre-attentive Properties • Relative Expressiveness of Visual Cues • Visual Illusions • Tufte’s notions • Graphical Excellence • Data-Ink Ratio Maximization • How to Lie with Visualization
References for Visual Principles • Kosslyn: Types of Visual Representations • Lohse et al: How do people perceive common graphic displays • Bertin, MacKinlay: Perceptual properties and visual features • Tufte/Wainer: How to mislead with graphs
A Graph is: (Kosslyn) • A visual display that illustrates one or more relationships among entities • A shorthand way to present information • Allows a trend, pattern, or comparison to be easily apprehended
Types of Symbolic Displays(Kosslyn 89) • Graphs • Charts • Maps • Diagrams
Types of Symbolic Displays • Graphs • at least two scales required • values associated by a symmetric “paired with” relation • Examples: scatter-plot, bar-chart, layer-graph
Types of Symbolic Displays Charts • discrete relations among discrete entities • structure relates entities to one another • lines and relative position serve as links Examples: family tree flow chart network diagram
Types of Symbolic Displays • Maps • internal relations determined (in part) by the spatial relations of what is pictured • labels paired with locations Examples: map of census data topographic maps From www.thehighsierra.com
Types of Symbolic Displays Diagrams • schematic pictures of objects or entities • parts are symbolic (unlike photographs) • how-to illustrations • figures in a manual From Glietman, Henry. Psychology. W.W. Norton and Company, Inc. New York, 1995
Anatomy of a Graph (Kosslyn 89) • Framework • sets the stage • kinds of measurements, scale, ... • Content • marks • point symbols, lines, areas, bars, … • Labels • title, axes, tic marks, ...
Basic Types of Data • Nominal (qualitative) • (no inherent order) • city names, types of diseases, ... • Ordinal (qualitative) • (ordered, but not at measurable intervals) • first, second, third, … • cold, warm, hot • Interval (quantitative) • list of integers or reals
length of page length of access Common Graph Types # of accesses # of accesses length of access URL url 1 url 2 url 3 url 4 url 5 url 6 url 7 45 40 35 # of accesses 30 length of access 25 20 15 10 5 0 long long very short # of accesses medium days length of page
Combining Data Types in Graphs Examples?
Scatter Plots • Qualitatively determine if variables • are highly correlated • linear mapping between horizontal & vertical axes • have low correlation • spherical, rectangular, or irregular distributions • have a nonlinear relationship • a curvature in the pattern of plotted points • Place points of interest in context • color representing special entities
When to use which type? • Line graph • x-axis requires quantitative variable • Variables have contiguous values • familiar/conventional ordering among ordinals • Bar graph • comparison of relative point values • Scatter plot • convey overall impression of relationship between two variables • Pie Chart? • Emphasizing differences in proportion among a few numbers
Interesting Findings Lohse et al. 94 • Photorealistic images were least informative • Echos results in icon studies – better to use less complex, more schematic images • Graphs and tables are the most self-similar categories • Results in the literature comparing these are inconclusive • Cartograms were hard to understand • Echos other results – better to put points into a framed rectangle to aid spatial perception • Temporal data more difficult to show than cyclic data • Recommend using animation for temporal data
Visual Properties • Preattentive Processing • Accuracy of Interpretation of Visual Properties • Illusions and the Relation to Graphical Integrity All Preattentive Processing figures from Healey 97http://www.csc.ncsu.edu/faculty/healey/PP/PP.html
Preattentive Processing • A limited set of visual properties are processed preattentively • (without need for focusing attention). • This is important for design of visualizations • what can be perceived immediately • what properties are good discriminators • what can mislead viewers
Example: Color Selection Viewer can rapidly and accurately determine whether the target (red circle) is present or absent. Difference detected in color.
Example: Shape Selection Viewer can rapidly and accurately determine whether the target (red circle) is present or absent. Difference detected in form (curvature)
Pre-attentive Processing • < 200 - 250ms qualifies as pre-attentive • eye movements take at least 200ms • yet certain processing can be done very quickly, implying low-level processing in parallel • If a decision takes a fixed amount of time regardless of the number of distractors, it is considered to be preattentive.
Example: Conjunction of Features Viewer cannotrapidly and accurately determine whether the target (red circle) is present or absent when target has two or more features, each of which are present in the distractors. Viewer must search sequentially. All Preattentive Processing figures from Healey 97http://www.csc.ncsu.edu/faculty/healey/PP/PP.html
Example: Emergent Features Target has a unique feature with respect to distractors (open sides) and so the group can be detected preattentively.
Example: Emergent Features Target does not have a unique feature with respect to distractors and so the group cannot be detected preattentively.
Asymmetric and Graded Preattentive Properties • Some properties are asymmetric • a sloped line among vertical lines is preattentive • a vertical line among sloped ones is not • Some properties have a gradation • some more easily discriminated among than others
Use Grouping of Well-Chosen Shapes for Displaying Multivariate Data
Preattentive Visual Properties(Healey 97) length Triesman & Gormican [1988] width Julesz [1985] size Triesman & Gelade [1980] curvature Triesman & Gormican [1988] number Julesz [1985]; Trick & Pylyshyn [1994] terminators Julesz & Bergen [1983] intersection Julesz & Bergen [1983] closure Enns [1986]; Triesman & Souther [1985] colour (hue) Nagy & Sanchez [1990, 1992]; D'Zmura [1991] Kawai et al. [1995]; Bauer et al. [1996] intensity Beck et al. [1983]; Triesman & Gormican [1988] flicker Julesz [1971] direction of motion Nakayama & Silverman [1986]; Driver & McLeod [1992] binocular lustre Wolfe & Franzel [1988] stereoscopic depth Nakayama & Silverman [1986] 3-D depth cues Enns [1990] lighting direction Enns [1990]
Gestalt Properties • Gestalt: form or configuration • Idea: forms or patterns transcend the stimuli used to create them. • Why do patterns emerge? • Under what circumstances? Why perceive pairs vs. triplets?
Gestalt Laws of Perceptual Organization (Kaufman 74) • Figure and Ground • Escher illustrations are good examples • Vase/Face contrast • Subjective Contour
More Gestalt Laws • Law of Proximity • Stimulus elements that are close together will be perceived as a group • Law of Similarity • like the preattentive processing examples • Law of Common Fate • like preattentive motion property • move a subset of objects among similar ones and they will be perceived as a group