Download

1 / 18
180 likes | 326 Views
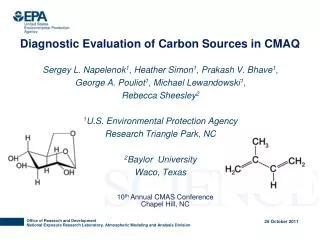
Diagnostic Study on Fine Particulate Matter Predictions of CMAQ in the Southeastern U.S. Ping Liu and Yang Zhang North Carolina State University, Raleigh, NC Shaocai Yu, Prakash V. Bhave, Robert W. Pinder, and Kenneth L. Schere

E N D
Diagnostic Study on Fine Particulate Matter Predictions of CMAQ in the Southeastern U.S. Ping Liu and Yang Zhang North Carolina State University, Raleigh, NC Shaocai Yu, Prakash V. Bhave, Robert W. Pinder, and Kenneth L. Schere Atmospheric Sciences Modeling Division, NOAA, Research Triangle Park, NC
Outline • Background • Model configurations and operational evaluation • Objectives and approaches • Diagnostic study • Integrated process rate (IPR) analysis • Sensitivity simulations • Summary
Model Configurations & Objective • Configurations • Model:CMAQ v4.4 • Episode:Contiguous United States, June 12-28, 1999 • Domain:32 km, 178 × 124 horizontal grid cells 21 layers from surface (first layer top, ~35 m) to the tropopause (~16 km) • Meteorology:MM5 v3.4 • Emissions:EPA’s 1999 NEI v3, SMOKE v1.4 • Initial and boundary conditions (ICs/BCs):EPAdefault files • Gas-phase mechanism:SAPRC99 • Aerosol module:AERO3 • Spin-up:June 12-13 • Objectives and Approaches • Identify large contributors to the model biases in CMAQ aerosol predictions • Process analysis: Integrated process rate (IPR) analysis Integrated reaction rate (IRR) analysis • Correlation analysis and sensitivity simulations for influential processes
Spatial Distribution of Simulated and Observed O3 and PM2.5 O3 at AIRS-AQS sites (15-day mean of max. 8hr-average) PM2.5 at IMPROVE sites (15-day mean of 24hr-average)
Integrated Process Rate (IPR) Analysis • Column IPR analysis • Average export in the PBL in urban and rural areas • IPR correlation analysis • Process contribution versus large model bias at urban and rural sites • Large model bias: 2.6 km 0 km Block: 9 grid cells Column: layers 1-14
Column IPR Analysis at SEARCH Sites SO42- PM2.5 NO3- NH4+
IPR Correlation Analysis: SO42- All Sites Urban ○: dry deposition□: aerosol processes∆: cloud processes Rural • Aerosol and cloud processes are slightly correlated • Dry deposition is largely correlated
IPR Correlation Analysis: NO3- All Sites Urban ○: dry deposition□: aerosol processes∆: cloud processes Rural • Aerosol and cloud processes are large contributors; dry deposition is a small contributor • No obvious correlations are found for all processes
IPR Correlation Analysis: NH4+ All Sites Urban ○: dry deposition□: aerosol processes∆: cloud processes Rural • Aerosol processes are a large contributor and correlated • Cloud processes and dry deposition are small contributors and weakly correlated
IPR Correlation Analysis: PM Precursors SO2 vs. SO42- HNO3 vs. NO3- ○: dry deposition□: aerosol processes∆: cloud processes NH3 vs. NH4+ • Cloud processes and dry deposition of SO2 are sometimes correlated with SO42- biases • Dry deposition of HNO3is a large contributor and sometimes correlated with NO3- biases • Aerosol processes of NH3are correlated with NH4+ biases
IPR Correlation Analysis: PM Precursors ESO2 vs. SO42- ENOx vs. NO3- ENH3 vs. NH4+ • SO2 emissions are largely correlated with SO42- biases • NOx and NH3emissions are sometimes correlated with NO3- and NH4+ biases, respectively
Sensitivity Simulations • Dry deposition of NO3- and NH4+ precursors • Reduce dry deposition velocity of HNO3 and NH3 by 50% (based on literature review and field study) • Emissions of NH3 and SO2 • Increase NH3 emissions by 25.5% (based on the CMU Ammonia Model) • Reduce SO2 emissions by 20% (CMAQ overpredicts SO42- by 20%) • Cloud processes of SO42- • Adjust [H2O2]aq using a dissolution efficiency factor of 0.9 (MM5 overestimates observed cloud fractions by roughly 10%) • Rate constant of the gas-phase SO2 oxidation reaction by OH • Replace kr, SAPRC99 by kr, CB05 (kr, SAPRC99 > kr, CB05, e.g., T = 288 K, P = 1013 Pa, kr, SAPRC99 = 1.12 kr, CB05)
Dry Deposition of PM Precursors SEARCH IMPROVE CASTNet • Reducing vd, HNO3 can increase NO3- by 27-29%, and reduce | NMB | by 8-94% • Reducing vd, NH3 can increase NO3- by 18-21%, and reduce | NMB | by 7-65% • Increasing vd, SO2 can decrease SO42- by 2%, and reduce NMB by 13-16%
NH3 and SO2 Emissions SEARCH IMPROVE CASTNet • Increasing ENH3 can increase NO3- by 43-73%, and reduce | NMB | by 26-50% • Reducing ESO2 can reduce SO42- by 15-16%, and reduce | NMB | by 79-94%
Gas & Aqueous-Phase Oxidation of SO2 SEARCH IMPROVE CASTNet • Using kr, CB05 for SO2 (g) + OH can reduce SO42- by 3% and reduce NMB by 15-85% • Reducing dissolved [H2O2] by 10% has negligible effects on SO42- formation for this episode
Effects of Multiple Adjustments SEARCH IMPROVE Multiple adjustments: 1.2551 × ENH3; 0.8 × ESO2; kr, CB05; 0.84 × vd, HNO3 CASTNet • SO42- is reduced by 16-19% and |NMB| is reduced by 79-97% • NO3- is increased by 74-127%; |NMB| is reduced by 44% and 73% at IMPROVE and SEARCH sites but increased by 50% at CASTNet sites • NH4+ is increased by 1-8%, |NMB| is reduced by 16% at SEARCH sites but increased by 19% and 6% at IMPROVE and CASTNet sites
Summary • Aerosol processes are large contributors to the formation of SO42-, NO3-, and NH4+, and correlated with the biases in SO42- and NH4+; cloud processes contribute largely to rural NH4+, but weakly correlated with secondary PM; dry deposition is a large contributor and correlated with SO42- biases • Emissions, aerosol/cloud processes, and dry deposition of PM precursors may contribute to the model biases of the secondary PM • Adjusting the most influential processes/factors (i.e., ENH3, ESO2, vd, HNO3, and kSO2+OH) improves the model overall performance in terms of SO42-, NO3-, and NH4+
Acknowledgments & Disclaimer • NSF Award No. Atm-0348819 • Steve Howard and Alice Gilliland (NOAA/EPA), for providing the Fortran code for extracting data from CMAQ and the CASTNet, IMPROVE, and AIRS-AQS observational databases • Members of Air Quality Forecasting Lab at NCSU The research presented here was performed under the Memorandum of Understanding between the U.S. Environmental Protection Agency (EPA) and the U.S. Department of Commerce’s National Oceanic and Atmospheric Administration (NOAA) and under agreement number DW 13921548.This work constitutes a contribution to the NOAA Air Quality Program.Although it has been reviewed by EPA and NOAA and approved for publication, it does not necessarily reflect their policies or views.