Download
1 / 16
170 likes | 304 Views
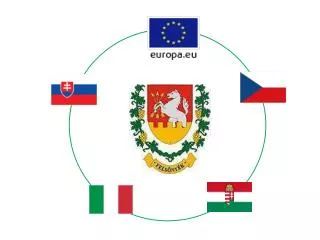
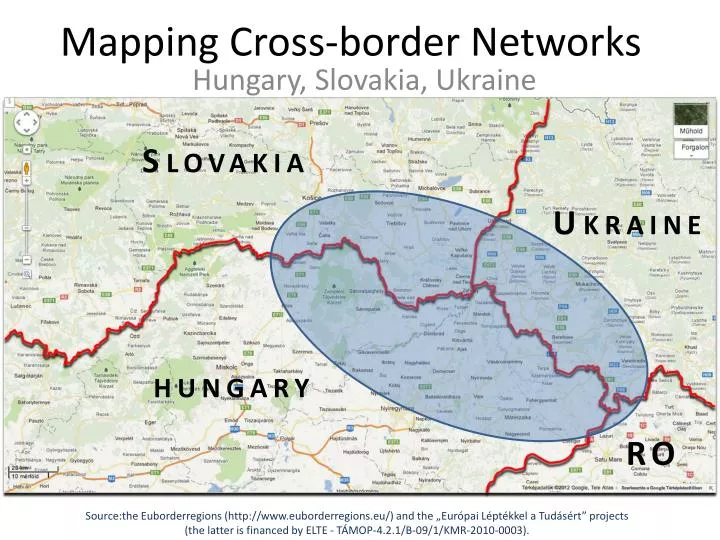
Slovakia. Mapping Cross-border Networks. Ukraine. Hungary, Slovakia , Ukraine. hungary. RO. Source:the Euborderregions (http://www.euborderregions.eu/) and the „ Európai Léptékkel a Tudásért ” projects (the latter is financed by ELTE - TÁMOP-4.2.1/B-09/1/KMR-2010-0003).

E N D
Slovakia Mapping Cross-border Networks Ukraine Hungary, Slovakia, Ukraine hungary RO Source:the Euborderregions (http://www.euborderregions.eu/) and the „EurópaiLéptékkel a Tudásért” projects (the latter is financed by ELTE - TÁMOP-4.2.1/B-09/1/KMR-2010-0003).
Why networks? • What kind of networks? • Who are the stakeholders participating in the networks? • Is there any network effect on attitudes towards EU, economic growth, or quality of life?
Methodology • Data collection: • 143 stakeholders (organization or person) has been collected by 4 rounds of snow-ball sampling • 15 face to face interviews (round 0) • 53 phone interviews - Cross-border Questionnaire
Building thedatabase Attributes List of organizations participating in the research Relations List of relations between organizations Source:the Euborderregions (http://www.euborderregions.eu/) and the „EurópaiLéptékkel a Tudásért” projects (the latter is financed by ELTE - TÁMOP-4.2.1/B-09/1/KMR-2010-0003).
The whole network • Fragmented network • The largest component: N = 58 (41%) • Mostly Slovakian-Hungarian ties • Low clustering • coefficient Nr01 Hungary Nr03 Ukraine Nr02 Slovakia
Cross-Border relations Cross-border relations: 42% Hungary Ukraine Slovakia
Whole network: Internal and cross-border Cross-border
Whole settlement network Stakeholders’ links aggregated by settlements Slovakia Ukraine RO hungary
Cross-border network Slovakia Ukraine RO hungary
Twin settlements in the CBR Márton, GERŐ – István, MICSINAI Source:the Euborderregions (http://www.euborderregions.eu/) and the „EurópaiLéptékkel a Tudásért” projects (the latter is financed by ELTE - TÁMOP-4.2.1/B-09/1/KMR-2010-0003).
Cross-border network between Hungary and Slovakia • Miskolc and Kassa (Kosice) are the center of the two regions. • Miskolc is more embedded than Kosice, it has connections with larger cities and villages on the other side of the border. • Kosice has connections only with similar-sizedcities. • We can see strong co-operation through the border between smaller villages. • The villages on the Slovakian side has significant Hungarian population – it supports co-operation
Cross-border network between Hungary and Ukraine • Nyíregyháza is the Hungarian center of the region, but there is no center on the Ukranian side. • We see cross-border relations between cities, no village appearsin the network. Ukraine isn’t a member of the Schengen area, so the citizens of Ukraine has to apply for visa before entering Slovakia or Hungary. (60€ for three months)
Proportion of cross-sectorial relations internal/crossborder Source:the Euborderregions (http://www.euborderregions.eu/) and the „EurópaiLéptékkel a Tudásért” projects (the latter is financed by ELTE - TÁMOP-4.2.1/B-09/1/KMR-2010-0003).
Attitudes Do you think that EU CBC projects in the past five years have had any impact? %(N)
Cross-Border relations and opinion on the effects of CBC projects Do you think that EU CBC projects in the past five years have had any impact on your organization? (% (N)) Effect of behavior? Sharing (or recommending) causes higher commitment?
Thank you for your attention! Márton, GERŐ – István, MICSINAI ELTE TÁTK – MTA TK-SZI gero@socio.mta.hu ELTE TÁTK istvan.micsinai@gmail.com Source:the Euborderregions (http://www.euborderregions.eu/) and the „EurópaiLéptékkel a Tudásért” projects (the latter is financed by ELTE - TÁMOP-4.2.1/B-09/1/KMR-2010-0003).