Download
1 / 26
260 likes | 448 Views
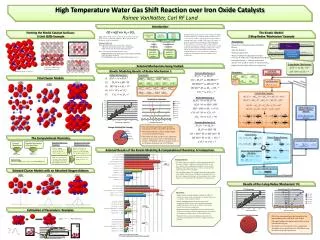
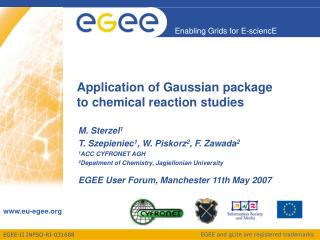
Application of reaction route graphs to microkinetic analysis and design of water-gas-shift catalysts. Caitlin A. Callaghan, Ilie Fishtik and Ravindra Datta. Fuel Cell Center Chemical Engineering Department Worcester Polytechnic Institute Worcester, MA. Introduction.

E N D
Application of reaction route graphs to microkinetic analysis and design of water-gas-shift catalysts Caitlin A. Callaghan, Ilie Fishtik and Ravindra Datta Fuel Cell Center Chemical Engineering Department Worcester Polytechnic Institute Worcester, MA
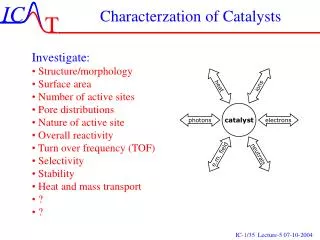
Introduction • First principles calculations are becoming indispensable • Molecular rearrangements on surfaces can be “seen” • Reaction energetic calculations are becoming more reliable • Microkinetic models are becoming increasingly available • What more can be done?
Kinetics LHHW Approach • Rate expressions derived based on RDS, QE, QSSA, MARI • Fitted to data • Basic mechanism and assumptions are generally arbitrary Microkinetic Approach • Involves elementary reaction kinetics • No simplifying assumptions made • Arbitrary mechanism • Substantial computational effort is required • Opaque
Reaction Route Graph Theory • Powerful new tool in graphical and mathematical depiction of reaction mechanisms • New method for mechanistic and kinetic interpretation • “RR graph” differs from “Reaction Graphs” • Branches elementary reaction steps • Nodes multiple species, connectivity of elementary reaction steps • Reaction Route Analysis, Reduction and Simplification • Enumeration of direct reaction routes • Dominant reaction routes via network analysis • RDS, QSSA, MARI assumptions based on a rigorous De Donder affinity analysis • Derivation of explicit and accurate rate expressions for dominant reaction routes
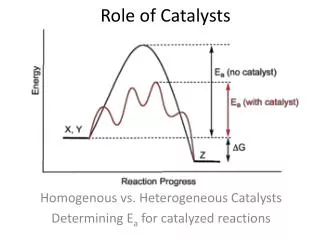
RR Graphs A RR graph may be viewed as hikes through a mountain range: • Valleys are the energy levels of reactants and products • Elementary reaction is hike from one valley to adjacent valley • Trek over a mountain pass represents overcoming the energy barrier STOP START
RR Graph Topology • Overall Reaction Routes (ORRs): • a RR in which the desired OR is produced • Empty Reaction Routes (ERRs): • a RR in which a zero OR is produced (a cycle) • Intermediate Nodes (INs): • a node including ONLY the elementary reaction steps • Terminal Nodes (TNs): • a node including the OR in addition to the elementary reaction steps
Electrical Analogy a b e c d f g i h • Kirchhoff’s Current Law • Analogous to conservation of mass • Kirchhoff’s Voltage Law • Analogous to thermodynamic consistency • Ohm’s Law • Viewed in terms of the De Donder Relation
The WGSR Mechanism On Cu(111) a - activation energies in kcal/mol (θ 0 limit) estimated according to Shustorovich & Sellers (1998) and coinciding with the estimations made in Ovesen, et al. (1996); pre-exponential factors from Dumesic, et al. (1993). b – pre-exponential factors adjusted so as to fit the thermodynamics of the overall reaction; The units of the pre-exponential factors are Pa-1s-1 for adsorption/desorption reactions and s-1 for surface reactions.
Constructing the RR Graph 1. Select the shortest MINIMAL ORR OR = s1 + s2 + s3 + s5 + s10 + s14 s1 s2 s14 s10 s3 s5 s5 s3 s10 s14 s2 s1
Constructing the RR Graph 2. Add the shortest MINIMAL ERR to include all elementary reaction steps s7 + s8 – s12 = 0 s4 + s6 – s14 = 0 s7 + s9 – s10 = 0 s4 + s9 – s15 = 0 s12 + s15 – s17 = 0 s4 + s11 – s17 = 0 s11 s17 s8 s12 s1 s2 s14 s10 s3 s5 s9 s6 s7 s4 Only s13 and s16are left to be included s15 s15 s7 s4 s6 s9 s5 s3 s10 s14 s2 s1 s12 s8 s17 s11
Constructing the RR Graph 3. Add remaining steps to fused RR graph s13–s14 + s15 = 0 s12 + s13 – s16 = 0 s11 s17 s8 s12 s1 s2 s14 s10 s3 s5 s9 s6 s7 s4 s15 s16 s13 s13 s16 s15 s7 s4 s6 s9 s5 s3 s10 s14 s2 s1 s12 s8 s17 s11
Constructing the RR Graph 4. Balance the terminal nodes with the OR OR s1 s2 s14 s10 s3 s5 s13 s15 s11 s8 s17 s6 s4 s7 s16 s9 s12 s12 s16 s9 s7 s6 s4 s17 s8 s11 s15 s13 s5 s3 s10 s14 s2 s1 OR
Microkinetics • We may eliminate s13 and s16 from the RR graph; they are not kinetically significant steps • This results in TWO symmetric sub-graphs; we only need one n6 R7 R15 R12 R9 R1 n1 R2 n2 R6 n3 R17 n5 R8 n7 R3 n8 R5 R4 R11 R14 R10 n4 Aoverall + –
Network Reduction R4 + R6 vs. R14 Experimental Conditions Space time = 1.80 s FEED: COinlet = 0.10 H2Oinlet = 0.10 CO2 inlet = 0.00 H2 inlet = 0.00 n6 R7 R12 R15 R9 R1 n1 R2 n2 R6 n3 R17 n5 R8 n7 R3 n8 R5 R4 R11 R14 R10 n4 Aoverall + –
Network Reduction R4 + R6 vs. R14 Experimental Conditions Space time = 1.80 s FEED: COinlet = 0.10 H2Oinlet = 0.10 CO2 inlet = 0.00 H2 inlet = 0.00
Network Reduction Effect of R14 on Conversion Experimental Conditions Space time = 1.80 s FEED: COinlet = 0.10 H2Oinlet = 0.10 CO2 inlet = 0.00 H2 inlet = 0.00
Network Reduction R4 + R11 vs. R17 Experimental Conditions Space time = 1.80 s FEED: COinlet = 0.10 H2Oinlet = 0.10 CO2 inlet = 0.00 H2 inlet = 0.00 n6 R7 R12 R15 R9 R1 n1 R2 n2 R6 n3 R17 n5 R8 n7 R3 n8 R5 R4 R11 R10 n4 Aoverall + –
Network Reduction R4 + R11 vs. R17 Experimental Conditions Space time = 1.80 s FEED: COinlet = 0.10 H2Oinlet = 0.10 CO2 inlet = 0.00 H2 inlet = 0.00
Network Reduction Effect of R17 on Conversion Experimental Conditions Space time = 1.80 s FEED: COinlet = 0.10 H2Oinlet = 0.10 CO2 inlet = 0.00 H2 inlet = 0.00
Network Reduction R9 + R12 vs. R11 Experimental Conditions Space time = 1.80 s FEED: COinlet = 0.10 H2Oinlet = 0.10 CO2 inlet = 0.00 H2 inlet = 0.00 n6 R7 R12 R15 R9 R1 n1 R2 n2 R6 n3 n5 R8 n7 R3 n8 R5 R4 R11 R10 n4 Aoverall + –
Network Reduction R9 + R12 vs. R11 Experimental Conditions Space time = 1.80 s FEED: COinlet = 0.10 H2Oinlet = 0.10 CO2 inlet = 0.00 H2 inlet = 0.00
Network Reduction Effect of R9 and R12 on Conversion Experimental Conditions Space time = 1.80 s FEED: COinlet = 0.10 H2Oinlet = 0.10 CO2 inlet = 0.00 H2 inlet = 0.00
Network Reduction Experimental Conditions Space time = 1.80 s FEED: COinlet = 0.10 H2Oinlet = 0.10 CO2 inlet = 0.00 H2 inlet = 0.00 n6 R7 R15 R1 n1 R2 n2 R6 n3 n5 R8 n7 R3 n8 R5 R4 R11 R10 n4 Aoverall + –
Reduced Rate Expression R15 R7 n6 R6 R11 R8 n2 n3 n5 n7 R10 Aoverall Assume that OHS is the QSS species. where
Microkinetic Model Simulation for Cu Experimental Conditions Space time = 1.80 s FEED: COinlet = 0.10 H2Oinlet = 0.10 CO2 inlet = 0.00 H2 inlet = 0.00
Conclusions • Predicted kinetics can provide for reliable microkinetic models. • Reaction network analysis is a useful tool for reduction, simplification and rationalization of the microkinetic model. • Analogy between a reaction network and electrical network exists. • The analogy between reaction routes and electrical circuits provides a useful interpretation of kinetics and mechanism • Application of the proposed formalism to the analysis of the WGS reaction mechanism validated the reduced model developed earlier based solely on a numerical RR analysis.