Download
1 / 10
100 likes | 103 Views
This analysis examines the industry clusters in the Eastern Shore Region of Virginia, highlighting strengths, weaknesses, and potential areas of growth. It provides an overview of the region and detailed bubble charts for different industries.

E N D
REGIONAL SNAPSHOT Industry Cluster Analysis Eastern Shore Region, Virginia
01 02 Overview Table of contents Industry Cluster Analysis
01 • overview • Eastern Shore Region, VA
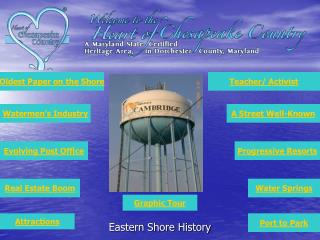
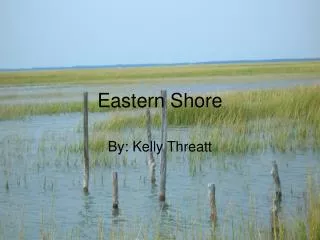
Overview Eastern Shore Region • The Eastern Shore Region is comprised of two counties in eastern Virginia. U.S. Highway 13 passes through the central part of the region connecting to Maryland and Delaware to the north and city of Norfolk, VA to the south. • Accomack • Northampton section 01
02 • Industry cluster analysis Eastern Shore Region, VA
Industry cluster analysis How to interpret cluster data resultsThe graph’s four quadrants tell a different story for each cluster. Contains clusters that are more concentrated in the region and are growing. These clusters are strengths that help a region stand out from the competition. Small, high-growth clusters can be expected to become more dominant over time. Contains clusters that are more concentrated in the region but are declining (negative growth). These clusters typically fall into the lower quadrant as job losses cause a decline in concentration. Mature Top left (strong but declining) Stars Top right (strong and advancing) Emerging Bottom right (weak but advancing) Transforming Bottom left (weak and declining) Contains clusters that are under-represented in the region (low concentration) and are also losing jobs. Clusters in this region may indicate a gap in the workforce pipeline if local industries anticipate a future need. In general, clusters in this quadrant show a lack of competitiveness. Contains clusters that are under-represented in the region but are growing, often quickly. If growth trends continue, these clusters will eventually move into the top right quadrant. Clusters in this quadrant are considered emerging strengths for the region. section 02 • Modified from: http://www.charlestonregionaldata.com/bubble-chart-explanation/
Industry and occupation Industry cluster bubble chart Star Mature Transforming Emerging Note: Manufacturing Supercluster, Apparel & Textiles and Miningclusters have too few jobs. Glass & Ceramics cluster does not exist in the region. section 02 • Source: EMSI Class of Worker 2014.4 (QCEW, non-QCEW, self-employed and extended proprietors). • Note: Label includes cluster name, LQ 2014, and Employment 2014; NAICS 2012 definitions
Industry and occupation Manufacturing sub-cluster bubble chart • Fabricated Metal Product Manufacturing and Electrical Equipment, Appliance & Component Manufacturing subclusters do not exist in the region. The rest of Manufacturing sub-clusters have insufficient number of jobs to be considered for analysis: • Machinery Manufacturing: 5 jobs • Primary Metal Manufacturing: 9 jobs • Computer & Electronic Product Manufacturing: 18 jobs • Transportation Equipment Manufacturing: 7 jobs section 02 • Source: EMSI Class of Worker 2014.4 (QCEW, non-QCEW, self-employed and extended proprietors).
Industry cluster analysis Level of Specialization Percent Growth in Specialization Note: Manufacturing Supercluster, Machinery Manufacturing, Primary Metal Manufacturing, Computer & Electronic Product Manufacturing, Transportation Equipment Manufacturing sub-clusters as well as Apparel & Textiles and Miningclusters have too few jobs. Glass & Ceramics, Fabricated Metal Product Manufacturing and Electrical Equipment, Appliance & Component Manufacturing sub-cluster do not exist in the region. section 02 NOTE: The first number after each cluster represents its location quotient while the second number represents the number of total jobs (full and part time jobs by place of work) in that cluster in the region in 2014. The clusters are sorted in decreasing order by location quotient.
Industry and occupation Bubble chart interpretation Star Industries Star industry clusters are highly concentrated, exporting and still experiencing growth in the region. The only highly concentrated of the Star industry clusters in the Eastern Shore Region is Arts, Entertainment, Recreation. & Visitor Industries. Its location quotient is 1.00, indicating that the cluster is concentrated in the region same as compared to the U.S. Emerging Industries Industry clusters that may be poised for future growth are classified as “Emerging.” There are five noticeable Emerging clusters in the Eastern Shore Region: Defense & Security, Business & Financial Services, Transportation & Logistics, Information Technology & Telecommunications and Education & Knowledge Creation. Mining and Transportation Equipment Manufacturing clusters are excluded due to low number of jobs in these clusters. Mature Industries Three industry clusters in the Eastern Shore Region are in the Maturing stage. Agribusiness, Food Processing & Technology, Chemicals/Chemical-based Products and Energy (Fossil & Renewable). These industries are relatively concentrated, but their growth is trending downward. It is worth noting, however, that the Eastern Shore Region may find it worthwhile to invest in efforts to shore up the concentration of these industries. Transforming Industries Transforming clusters capture the mix of industries that are experiencing relative decline and limited export capability. In the Eastern Shore Region, Biomed/Biotechnical (Life Science), Forest & Wood Products, Printing & Publishing, Advanced Materials, Primary Metal Mfg., Apparel & Textiles, Computer & Electronic Product Mfg., Manufacturing Supercluster and Machinery Mfg., are all Transforming clusters. Any amount of growth in these industries would require relatively large investments. section 02 • Source: EMSI Class of Worker 2014.4 (QCEW, non-QCEW, self-employed and extended proprietors).