Download
1 / 39
390 likes | 524 Views
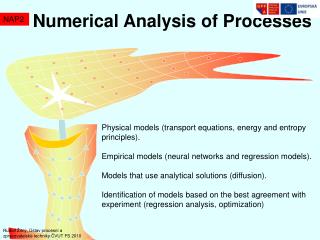
Numerical analysis of the behavior of shock wave in spheroid vessel. Yosuke Nishimura Naoki Kawaji Graduate School of Science and Technology Kumamoto University, Japan. Index. 1. Background of research 2. Purpose of research 3. Method of experiment 4. Result of experiment

E N D
Numerical analysis of the behavior of shock wave in spheroid vessel Yosuke NishimuraNaoki Kawaji Graduate School of Science and Technology Kumamoto University, Japan
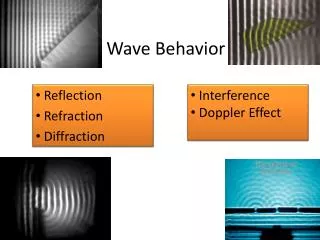
Index 1.Background of research 2.Purpose of research 3.Method of experiment 4.Result of experiment ● Property of typical underwater discharge ● Relationship of electrodes interval d & Imax ・ Pmax ● Relationship of cable length & Pmax ● Exceptional discharge phenomenon ● Result of numerical analysis 5.Conclusion ● The explanation of theimpulse large current equipment ● Method of measurement ● Numerical analysis
The conventional food processing by heating Eating habits become rich because the food processing technology develops. The conventional Food processing Boil Burn Steam For the improvement of safety and preservation Processing by heating However, as a problem Loss of nutrient Loss of nutrient
Food processing using underwater shock wave~New food processing technology~ ・ Processing is momentary. ・ Energy saving ・ The influence of heat is not almost caught. → Keeping of nutrition ・ Improvement of softening and extraction
Method of generating underwater shock wave The conventional method of generation Utilizing the underwater detonation of the explosive As a fault ・Redundancy of a cycle time ・Pollution of water by remains of the explosive ・ Legal restrictions Therefore ・・・ It proposes the utilization of the underwater shock wave generated by the electrical dischargeof impulse large current.
Purpose of research The device to generate high intensity shock wave is required in order to process various kinds of food. The purposes are following. It is investigated that optimum condition to generate high intensity shock wave and the behavior of converged shock wave. Maximum discharge power [W] is defined as barometer of intensity of shock wave, because measurement of pressure of shock wave was mistaken.
3. Method of experiment ● The explanation of theimpulse large current equipment ● Method of measurement ● Numerical analysis
The circuit diagram of theimpulse large current equipment Oil capacitor Made of Nichicon Corp Capacitance: 25μF Withstand voltage: 20kV Charge part
The circuit diagram of theimpulse large current equipment The hemispheres were employed for the electrode to obtain a semi-equal electric field. Generally a spark occurs without going by way of corona discharge. Discharge part Electrode interval 20 mm Made of brass
Vessel for shock wave convergence ●Property of reflector plate (Secondary focus) Pressure measurement point ・ Shape is spheroid. 90[mm] ・ Long radius is 103[mm]. Electrode ・ Short radius is 93[mm]. (Primary focus) 60[mm] d [mm] Discharge part The vessel was filled with water at the time of experiment. A pressure sensor was installed in secondary focus. Reflector plate polyacetal resin SUS
Metallic large container The metallic large container was employed at the time of experiment without the pressure measurement , since spheroid vessel has low durability. Electrode Silicon rubber for isolation Water
Method of measurement ● Current measurement ● Voltage measurement Grounded side High voltage cable High voltage side Rogowski coil Integrator electronics ・The voltage of capacitors was measured.
Flow of numerical analysis At first geometry data was created by use of SolidWorks (3D-CAD software produced by SolidWorks Japan). This geometry data was imported in HyperMesh (CAE software produced by Altair) and meshed. This FE data was imported in LS-DYNA 3D (CAE software produced by LSTC) and defined analysis condition.
Method of numerical analysis (2D) The size of this model is the same as vessel for shock wave convergence. Since it is difficult to simulate discharge phenomenon, SEP (High explosive made by kayaku-Japan) is installed in primary focus. The purpose of this simulation is to recognize propagation and convergence of shock wave. SUS Secondary focus 105 [mm] Water Calculation method 90 [mm] Euler:Air, Water , SEP Lagrange:SUS SEP 103 [mm] Air Equation of states Ignitionpoint (Primary focus) 60 [mm] GRUNEISEN : Water , SUS LINEAR_POLYNOMIAL : Air JWL:SEP 196[mm] Mesh size 1 x 1 x 1 (mm)
4.Result of experiment ● Property of typical underwater discharge ● Relationship of electrodes interval d & Imax ・ Pmax ● Relationship of cable length & Pmax ● Exceptional discharge phenomenon ● Result of numerical analysis
Property of typical underwater discharge The current of about 600[A] When high voltage was impressed between electrodes, the current of about 600[A] flowed through water. The voltage of discharge initiation was 7.8[kV] It took 5~20[ms] from impression of high voltage to initiation of discharge, and charge voltage decreased gradually in the meantime. The charge voltage before switching Vo was10[kV], but the voltage of discharge initiation was 7.8[kV].
Property of typical underwater discharge Damped oscillation current Air bubbles are generated by current and it resulted in arc electric discharge by discharge in air bubble. Initiation of discharge
Property of typical underwater discharge Damped oscillation current Air bubbles are generated by current and it resulted in arc electric discharge by discharge in air bubble. Phases differed 90 degrees. Initiation of discharge It is effect of inductance L=6.63[μH] included in measured circuit. Schematic of measured circuit and formula
Relationship of electrodes interval d & Imax ・ Pmax The larger electrodes interval d became, the smaller maximum discharge current Imax became. The cause is the following. When d become large the impedance of between electrodes increases and the voltage of discharge initiation decreases.
Relationship of electrodes interval d & Imax ・ Pmax In each charge voltage V0 there were d that Pmax became the largest. The larger electrodes interval d became, the smaller maximum discharge current Imax became. The cause is the following. When d become large Imax decreases, but discharge voltage Vd increase because the impedance of between electrodes increases. The cause is the following. When d become large the impedance of between electrodes increases and the voltage of discharge initiation decreases. The larger V0 become, the larger optimum electrodes interval become.
Relationship of cable length & Pmax When cable length was short, maximum discharge power Pmax was large. The cause is the following. When cable length become long, inductance Lincrease, and intersection point of Id &Vd becomes low, because Imax decreases and rising time of current become long.
Exceptional discharge phenomenon ●Typical waveform of current ●Exceptional waveform of current This mode occurred unusually. When electrode interval was large, it was easy to happen. Almost discharge was this mode.
Exceptional discharge phenomenon ●Typical waveform of current ●Exceptional waveform of current This mode occurred unusually. When electrode interval was large, it was easy to happen. Almost discharge was this mode. It is seemed that this shift happen when impedance R become large from any causes, and Pmax become large because energy is thrown in load efficiently in mode of critical damping.
Result of numerical analysis First wave reached secondary focus. (Secondary focus) Initiation Reflection (Primary focus) 0μs 30μs 60μs Reflected wave converged at secondary focus. 90μs 120μs
Graphs of pressure of shock wave (numerical analysis) Y direction Pressure of Reflected wave became maximum near secondary focus (Y=45[mm]). Center of ellipse Secondary focus
Graphs of pressure of shock wave (numerical analysis) Y direction Pressure of Reflected wave became maximum near secondary focus (Y=45[mm]). Center of ellipse Secondary focus Reflected wave The pressure of reflected wave was about 2.7 times larger than the pressure of first wave at secondary focus. (Secondary focus) Initiation (Primary focus)
Conclusion • Property of typical underwater discharge was confirmed. • The larger electrodes interval d become, the smaller maximum discharge current Imax become. • The larger V0 become, the larger optimum electrodes interval become. • When cable length is short, maximum discharge power Pmax is large. • The shift of waveform happen when impedance R become large from any causes, and Pmax become large • In the vessel for shock wave convergence pressure of reflected wave was about 2.7 times larger than the pressure of first wave at secondary focus.
Mode of waveform • R2<4L/C (Damped oscillation) • (b)R2=4L/C (Critical damping) • (c)R2>4L/C (Over damping) Energy is thrown in load efficiently in mode of critical damping.
Mechanism of dielectric breakdown Dielectric breakdown theory of liquid Electronic destruction Air bubble destruction In this experiment This shadow is air bubbles, air bubbles are generated by current and the “air bubble destruction” which results in the whole destruction for electric discharge in air bubbles is considered to be leading. It is considered that they are air bubbles.
Pressure measurement Schematic view