Download
1 / 34
340 likes | 496 Views
Electrical Energy Production. Figure 1. Total US Energy Consumption (1998). Figure 2. World Oil Consumption: 1950 and 1996. World Oil Consumption in 2001: 76.2 MBPD (a 24% increase in the 5-year period since 1996). Figure 3. Figure 4.

E N D
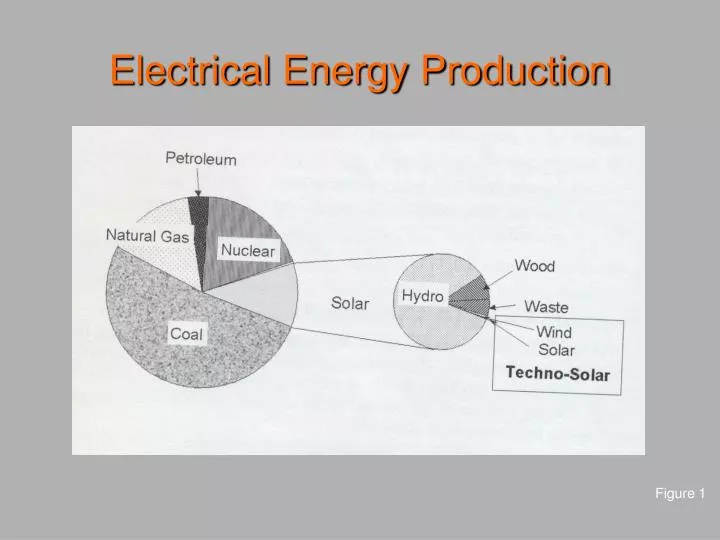
Electrical Energy Production Figure 1
Total US Energy Consumption (1998) Figure 2
World Oil Consumption: 1950 and 1996 World Oil Consumption in 2001: 76.2 MBPD (a 24% increase in the 5-year period since 1996) Figure 3
The Golden Triangle and US Military Bases in the Persian Gulf Figure 5
Cheney Energy Task Force Map of Iraqi Oilfields Obtained by Judicial Watch through the Freedom of Information Act Figure 6
Cheney Energy Task Force List of Foreign Suitors for Iraqi Oilfield Contracts Figure 7
Existing and Potential Oil and Gas Export Routes from the Caspian Basin Figure 8
Solar Power: Solar Two in the Mojave Desert Peak Output: 10 megawatts Figure 9
Solar Electric Generating System in Kramer Junction, CA Ave. daily output: 100 MW electricity Figure 10
Wind Power Nine Canyon Wind Project, Kennewick, WA Phase II Expansion Completed 12/29/03 Peak Output: 63.7 MW Figure 11
Geothermal Energy Hydrothermal Hot Dry Rock Figure 12
Grand Coulee Dam Peak Output: 6,500 MW Figure 15
Fish Hatcheries in the Columbia Basin Figure 16
Life Expectancy, Literacy Rate, and GDP per Capita Compared with Annual per Capita Electricity Use Figure 17
Columbia Generating Station Hanford Site, Kennewich, WA Output: 1,150 MW Figure 18
Figure 20 From Bernard L. Cohen, The Nuclear Energy Option (1990)
The Linear (No-Threshold) Hypothesis 100 % lethality 50 % 0.0625 % lethality 400 REM 600 REM Figure 21 0.5 REM 6,250 deaths from cancer in 10 million people exposed to 0.5 REM of radiation
The Linear (No-Threshold) Hypothesis-2 Figure 22
Radiation Doses (in millirem): Naturally Occurring and Statutory Limit for Nuclear Power Plants Figure 23
Sources of Day-to-Day Radiation Exposure Figure 24
Background Radiation and EPA and NRC Regulations B First standard (1930s-1950s) 36 rem/year Second standard 15 rem/year Current Occupational MPD: 5 rem/year Figure 25 From Mark M. Hart, “Disabling the terror of radiological dispersal,” Nuclear News July 2003
Death Rate of People in Nagasaki: Atom Bomb Survivors Compared with Those Not Exposed to Radiation Figure 26
30-Year Cancer Mortality in People Exposed to Radiation from a Thermonuclear Explosion in the Former Soviet Union Figure 27
Prevention of Cancer by Low Dose Radiation Figure 28
Chernobyl--1986 Figure 29
Three Mile Island Figure 30
Uranium and Fossil Fuel Resources in the United States Figure 31
Nuclear Fusion Power Plant Figure 32
Thermal Conversion Process Figure 33