Download
1 / 58
580 likes | 737 Views
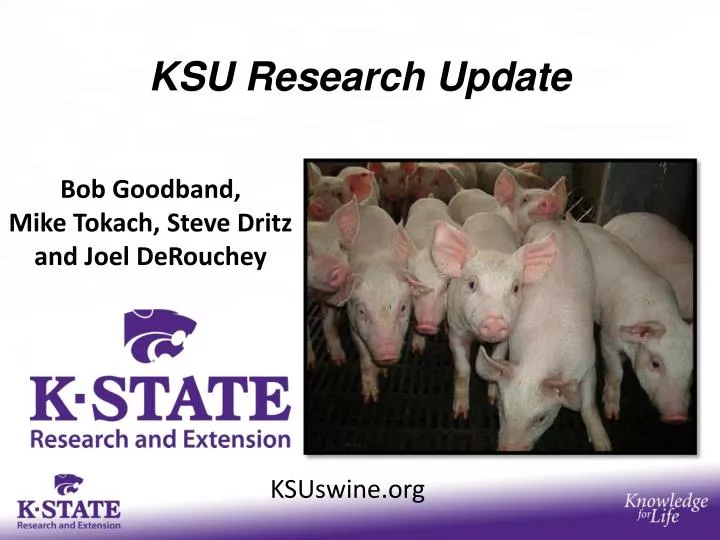
KSU Research Update. Bob Goodband, Mike Tokach, Steve Dritz and Joel DeRouchey. KSUswine.org. Introduction - Dried Distillers Grains with Solubles Research. Tryptophan requirements with DDGS. Evaluating energy values in DDGS with varying oil content.

E N D
KSU Research Update Bob Goodband, Mike Tokach, Steve Dritz and Joel DeRouchey KSUswine.org
Introduction - Dried Distillers Grains with Solubles Research • Tryptophan requirements with DDGS. • Evaluating energy values in DDGS with varying oil content.
Conclusions - Dried Distillers Grains with Solubles Research • Tryptophan requirements with DDGS • Economical to provide a margin of safety: >18% of SID Lysine • Evaluating energy in DDGS with varying oil content. • Oil content is VERY important; if less than 9% I get very concerned!
Introduction - Dried Distillers Grains with Solubles Research • Tryptophan requirements with DDGS. • Evaluating energy content in DDGS with varying oil content.
Effect of Trp:Lys ratio on ADG of pigs from 13 to 22 lb Linear = < 0.02 Quadratic = 0.33 SEM = 0.026 ADG, lb Tryptophan:lysine ratio, % Nitikanchana et al., 2011
Effect of Trp:Lys ratio on F/G of pigs from 13 to 22 lb Linear = < 0.06 Quadratic = 0.08 SEM = 0.039 Feed/gain Tryptophan:lysineratio, % Nitikanchana et al., 2011
Effect of TID Try:Lys in 30% DDGS diets on finishing ADG (d 0 – 42; initial BW 80 lb) a ab b c SID Trp:Lys Barnes et al., 2010
Effect of TID Try:Lys in 30% DDGS diets on finishing ADG (d 42 to 105; BW 160 to 290 lb) SID Trp:Lys Barnes et al., 2010
Effect of TID Try:Lys in 30% DDGS diets on finishing ADG (Exp. 2; d 0 to 73; BW 150 to 275 lb) with L-Trp SID Trp:Lys Barnes et al., 2010
Effect of TID Try:Lys in 30% DDGS diets on finishing F/G (Exp. 2; d 0 to 73; BW 150 to 275 lb) with L-Trp SID Trp:Lys Barnes et al., 2010
SID Trp:Lys ratio and Trp source for finishing pigs (Exp. 3; d 0 to 56; BW 156 to 285 lb) SID Trp:Lys Trp source Nitikanchana et al., 2012
SID Trp:Lys ratio and Trp source for finishing pigs (Exp. 6; d 0 to 56; BW 156 to 285 lb) SID Trp:Lys Trp source Nitikanchana et al., 2012
Summary – Tryptophan • Tryptophan requirements appear to be higher than what we used in the past. • Can add crystalline Tryptophan or lower the amount of L-lysine (increase SBM) addition to increase Trp:Lys ratio. • Economics suggest its better to have a safety value slightly above the requirement rather than being marginal.
The effects of medium-oil dried distillers grains with solubles (7.6% oil) on growth performance, carcass traits, and fat quality in growing-finishing pigs
Effect of Medium-oil DDGS on Average Daily Gain 7.6% fat, 28.1% CP, 10.8% ADF, 25.6% NDF Medium-oil DDGS Graham et al., 2012
Effect of Medium-oil DDGS on Feed Efficiency Medium-oil DDGS (7.6% oil) Graham et al., 2012
Effect of medium-oil DDGS on Carcass Yield Medium-oil DDGS (7.6% oil) Graham et al., 2012
Effect of Medium-oil DDGS on Jowl Fat Iodine Value Medium-oil DDGS (7.6% oil) Graham et al., 2012
Energy Systems for Swine Gross Energy Feces Digestible Energy Urine & gas MetabolizableEnergy Heat of digestion Net Energy
Evaluating Energy in Ingredients If caloric efficiency improves (F/G gets better) then we underestimated the energy content of the ingredient – its energy is greater than what we initially thought Poor Caloric Efficiency Good Increasing amount of test ingredient
Evaluating Energy in Ingredients Poor Caloric Efficiency If caloric efficiency worsens (F/G gets poorer) then we overestimated the energy content of the ingredient – its energy is less than what we initially thought Good Increasing amount of test ingredient
Evaluating Energy in Ingredients Poor If caloric efficiency doesn’t change at all then we correctly estimated the energy content of the ingredient – we pegged it! Caloric Efficiency Good Increasing amount of test ingredient
Effect of medium-oil DDGSon caloric efficiency Mcal/lb Graham et al., 2012
Effects of DDGS Source and Level on Average Daily Gain (d 0 to 82) 5.4% 9.6% Graham et al., 2013
Effects of DDGS Source and Level on Feed Efficiency (d 0 to 82) 5.4% 9.6% Graham et al., 2013
Effects of DDGS Source and Level on Carcass Yield 5.4% 9.6% Graham et al., 2013
Effects of DDGS Source and Level on Iodine Value 5.4% 9.6% Graham et al., 2013
Summary • ADG was unaffected by DDGS source or level • Increasing 5.4% oil DDGS increased ADFI and worsened F/G • Regardless of DDGS source, carcass yield and HCW decreased with increasing DDGS • Increasing DDGS increased jowl, belly and backfat IV, but the magnitude was greater in those fed the 9.6% oil DDGS compared with those fed 5.4% oil DDGS.
Determining energy content and nutrient digestibility of dried distillers grains with solubles with varying oil content
Net Energy efficiency calculations • Net energy efficiency (NEE) was determined by calculating the calories of NE intake in kcal/kg per kg of gain on a phase basis. • The NE of the DDGS sources was calculated based on the actual growth performance of the 3 studies using the 5 sources. • Used solving functions in Excel to set the NEE of pigs fed each DDGS source equal to that of the corn-soybean meal control diet. • This was done with the assumption that the NE content of corn and soybean meal are 2,672 and 2,087 kcal/kg, respectively (as-fed; NRC, 2012).
NE values, kcal/kg (as-fed) DDGS oil, %
DE and NE prediction equations • Stepwise regression was then used to establish DE and NE prediction equations. • Variables included in the regression analysis were the linear and quadratic terms of oil (ether extract), CP, CF, ADF, NDF, particle size, and bulk density. • Only oil (ether extract) content was found to be significant in the model.
Prediction equations • DE (kcal/kg) =62.347 * ether extract (%) + 3058.13 (n=5, Adjusted R2 = 0.41) • NE (kcal/kg) =115.011 * ether extract (%) + 1501.01 (n=5, Adjusted R2 = 0.86) • These equations indicate changing the oil content 1% in DDGS will change the DE by 62 kcal/kg and NE by 115 kcal/kg on an as-fed basis.
Corn DDGS quality control • Variability in DDGS quality • Main issue is fat level Fat, % NE, % • Low = < 5% fat 4.0 80.0% • Medium = 6 to 9% fat 7.5 87.5% • High = > 9% fat 11.0 100% • Need to monitor DDGS quality or work with company that monitors DDGS quality • Ethanol plants guarantee often underestimate the true oil content – guarantee 6% but really 9%
Conclusions • Swine producers and nutritionists can now better estimate the feeding and economic value of various DDGS sources based on their oil content.
K-State Web Resources www.ksuswine.org • DDGS Calculator • Synthetic Amino Acid Calculator • Fat Analysis Calculator • Feed Budget Calculator • Feeder Adjustment Cards • Particle Size Information • Marketing Calculators • Gestation Feeding Tools
Thank You! KSUswine.org
Effects of particle size on feed efficiency 1.2% per 100 microns 1.0% per 100 microns F/G Particle size, microns Particle size, microns
Every 100 microns = F/G improves by ~1.2% 7 lbs less feed/finishing pig Current $0.98/pig savings in feed cost
Grain Particle Size • F/G directly impacted by particle size of cereal grains • Research in high co-product diets: • While corn in diet is decreased, finishing pigs still respond similarly to improved F/G with reduced corn particle size • Whole diet grinding – not a benefit in meal diets • High fiber, low digestibly ingredients may be negatively affected by particle size reduction. • Takes more time/energy to grind cereals finer, however, less total tonnage is manufactured by the mill. • Testing method impacts results: • Lab using a flow agent will report a value approximately 80 µ lower then actual.
Why a feed link? • Introduction of foreign virus from a location where a large number of feed ingredients are sourced • Initial cases across multiple states in a similar time frame
Feed • Virtually no scientific literature linking viral transfer in feed for transmission of swine disease • Feed has never been linked to transmission in Europe or Asia • Sampling and testing of feed for PEDV is not warranted without clinical signs present • No way to test feed to guarantee free • Tests not validated for feed
Potential for increase risk: • Specialty proteins in nursery diets • Porcine Derived from infected pigs • Enteric derived products • Plasma protein • Blood Meal • Other Animal proteins (would need cross contamination) • Fish meal • Meat and bone meal • Bovine Blood products • Poultry meals • Carriers
Potential for increase risk: • Cross contamination – fecal matter • Need dual purpose transport • Reusing containers or totes • Ingredients sourced from endemic areas • Vitamins, trace minerals, additives from China • Can remain active in desiccated form • Thus, spray-drying has potential for preserving virus in an infective form • Unaware of any documented evidence this can occur
Example of one investigation of minor ingredient sourcing in pig diets: