Download
1 / 5
60 likes | 67 Views
LECTURE #7 Global Trends in Violent Conflict, 1946-2002. Data are for 158 countries with populations of at least 500,000 with 500 or more deaths directly related to war between 1946 and 2002. The magnitude of armed conflict is determined by the total number of combatants and

E N D
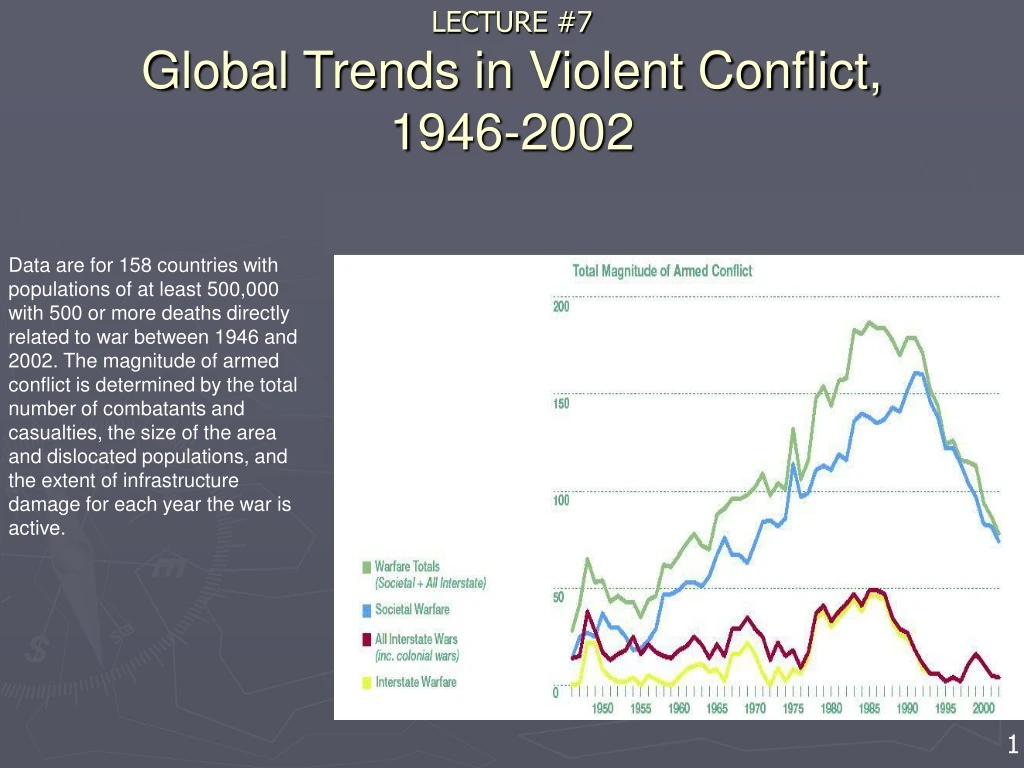
LECTURE #7Global Trends in Violent Conflict, 1946-2002 Data are for 158 countries with populations of at least 500,000 with 500 or more deaths directly related to war between 1946 and 2002. The magnitude of armed conflict is determined by the total number of combatants and casualties, the size of the area and dislocated populations, and the extent of infrastructure damage for each year the war is active. 1
Data in this map are for 158 countries with populations of at least 500,000 with 500 or more deaths directly related to war between 1946 and 2002. A country’s chance of avoiding war on its own territory is high if a country has no recent history of armed conflict, lacks or manages internal groups that wish to break away and form their own country, maintains stable and equitable democratic institutions, is well to do, and is free of serious external threats. Assigning a number to each of these factors and adding the numbers for each country yields a figure suggesting the risk of war breaking out in the territory of each country. Dividing the country scores into three categories (low-, medium-, and high-risk) and assigning different colors to each category allows us to create this world map. The 34 red-flagged countries, most in Africa, are at serious risk of war. Examples are Pakistan, Algeria, and Nigeria. The 50 yellow-flagged countries, among them India, China, and Russia, are at moderate risk of war. The 74 green-flagged countries, including most of Western Europe and North and South America, are at low risk of war. Of course, countries that avoid war on their own territory may nonetheless engage in war elsewhere, the United States being the prime example. Since 1850, the United States has intervened militarily in other countries more than once a year on average. Immediate risk of war in a country’s territory low medium high LECTURE #7The Risk of War, 2002 2
LECTURE #7Type of Government by Income Category, 1990s Percent Income Category 3
LECTURE #7Casualties Due to International Terrorist Attacks, 1991-2002 Title 22 of the United States Code defines terrorism as “premeditated, politically motivated violence against noncombatant targets [including unarmed or off duty military personnel] by subnational groups or clandestine agents, usually intended to influence an audience.” However, as Baruch Kimmerling, Israel’s leading sociologist, points out, a broader definition would include “the use [by states] of indiscriminate violence against civilians in order to achieve military and political goals. Moreover, the label ‘terror’ is subject to interpreta- tion. What one side in a conflict would call terror might be regarded by the other side as legitimate resistance to occupation, as well as ethnic, religious or national oppression.” Frequency Percent of casualties in Asia and Africa 1997 90.4% 1998 81.0% 1999 97.2% 2000 98.0% 2001 24.2% 2002 97.9% Trend line Year 4
Sources #1, #2, and #3 Marshall, Monty G. and Ted Robert Gurr. 2003. Peace and Conflict 2003. College Park MD: Department of Government and Politics, University of Maryland. On the World Wide Web at http://www.cidcm.umd.edu/inscr/PC03print.pdf (June 3). #4 U.S. Department of State. 1997. 1996 Patterns of Global Terrorism Report. On the World Wide Web at http://www.state.gov/www/global/terrorism/1996Report/1996index.html#table (June 3, 2003). __________. 2003. Patterns of International Terrorism 2002. On the World Wide Web at http://www.state.gov/s/ct/rls/pgtrpt/2002/pdf/ (June 3). 5