Download
1 / 42
420 likes | 609 Views
ECE 530 – Analysis Techniques for Large-Scale Electrical Systems. Lecture 3: Power System Modeling. Prof. Tom Overbye Dept. of Electrical and Computer Engineering University of Illinois at Urbana-Champaign overbye@illinois.edu. Announcements.

E N D
ECE 530 – Analysis Techniques for Large-Scale Electrical Systems Lecture 3: Power System Modeling Prof. Tom Overbye Dept. of Electrical and Computer Engineering University of Illinois at Urbana-Champaign overbye@illinois.edu
Announcements • Class will make extensive use of PowerWorld Simulator. If you do not have a copy of v17, the free 42 bus student version is available for download at http://www.powerworld.com/gloversarmaoverbye • Start getting familiar with this package. Free training material is available at http://www.powerworld.com/training/online-training
Generation Transmission Distribution Customer Service Vertical Monopolies • Within a particular geographic market, the electric utility had an exclusive franchise In return for this exclusive franchise, the utility had the obligation to serve all existing and future customers at rates determined jointly by utility and regulators It was a “cost plus” business
Vertical Monopolies • Within its service territory each utility was the only game in town • Neighboring utilities functioned more as colleagues than competitors • Utilities gradually interconnected their systems so by 1970 transmission lines crisscrossed North America, with voltages up to 765 kV • Economies of scale keep resulted in decreasing rates, so most every one was happy
History, cont’d -- 1970’s • 1970’s brought inflation, increased fossil-fuel prices, calls for conservation and growing environmental concerns • Increasing rates replaced decreasing ones • As a result, U.S. Congress passed Public Utilities Regulator Policies Act (PURPA) in 1978, which mandated utilities must purchase power from independent generators located in their service territory (modified 2005) • PURPA introduced some competition
History, cont’d – 1990’s & 2000’s • Major opening of industry to competition occurred as a result of National Energy Policy Act of 1992 • This act mandated that utilities provide “nondiscriminatory” access to the high voltage transmission • Goal was to set up true competition in generation • Result over the last few years has been a dramatic restructuring of electric utility industry (for better or worse!) • Energy Bill 2005 repealed PUHCA; modified PURPA
Utility Restructuring • Driven by significant regional variations in electric rates • Goal of competition is to reduce rates through the introduction of competition • Eventual goal is to allow consumers to choose their electricity supplier
OFF OFF The Result for California in 2000/1
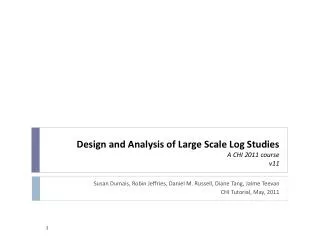
WA ME MT VT ND MN OR NH ID SD WI NY MA WY MI RI PA CT IA NV NE NJ OH IN DE IL UT DC W VA MD CO VA KS CA MO KY NC AZ TN OK NM AR SC GA MS AL TX LA AK FL HI electricity restructuring suspended restructuring delayed restructuring no activity Source : http://www.eia.doe.gov/cneaf/electricity/chg_str/regmap.html The California-Enron Effect
The Rise of Natural Gas Generation Source: US EIA, 2011
The Rise of Renewables: Wind Currentlyabout 6%of our electric capacityis wind The up/downsin 2001/2 and2003/4 werecaused by expiring tax credits
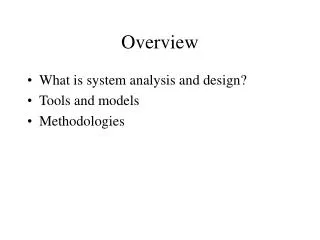
Rise of Renewables: Solar Total US PV Capacity Should Reach 5.3 GW in 2013 Source: http://solartribune.com/wp-content/uploads/2013/06/credited_SEIA_U.S.-PV-installations-by-quarter.jpg
Interconnected Power System Basic Characteristics • Three – phaseAC systems: • generation and transmission equipment is usually three phase • industrial loads are three phase • residential and commercial loads are single phase and distributed equally among the phases; consequently, a balanced three – phase system results • Synchronous machines generate electricity • Exceptions: some wind is induction generators; solar PV • Interconnection transmits power over a wider region with subsystems operating at different voltage levels
Power Systems: Basic Characteristics • The transmission network consists of following • the high voltage transmission system; • frequently, the subtransmission system; • sometimes, even the distribution system • The transmission system forms the backbone of the integrated power system and operates at the highest voltage levels; typically, above 150 kV • Less losses at high voltages (S=VI* and I2R losses), but more difficult to insulate. • The subtransmission levels are in the 69 to138 kVrange
Power Systems: Basic Characteristics • The generator output voltages are typically in the 11kV to 35 kV range and step up transformers are used to transform the potentials to transmission system voltage levels • Wind turbines have voltages in 600V range • Bulk power system, which includes the transmission system and generators, is networked
Power Systems: Basic Characteristics • Electrical devices are joined together at buses • The distribution system is used to supply the electricity to the consumers • primary distribution voltages are in the 4 kV to34.5kVrange at which industrial customers obtain their electricity supply • secondary distribution voltage is 120/240 V to the residential/commercial customers • distribution system is usually radial, except in some urban areas A Substation Bus
Electricity Supply • The basic function of a power system is to convert energy from one source to the electrical form; a key characteristic is that energy is not consumed as electricity but converted into heat, light, sound, mechanical energy or information • The widespread use of electricity is due to its ability to transport and control efficiently and reliably • Electricity is, by and large, a relatively clean source of energy • Most forms of renewable energy are created in the form of electricity; examples include hydro, wind and solar.
Fundamental Power System Requirements • System must be able to track load continuously: continuous balance of supply and demand • System must provide reliable supply of electricity at least cost • System must have least environmental impacts in providing electricity to meet its customers’ demands Daily Load Variation Yearly Load Variation
Fundamental Requirements of a Power System • Electric power delivery by the system must meet minimum standards of power quality • constant frequency • constant voltage • adequate reliability • System must be able to supply electricity even when subjected to a variety of unexpected contingencies, such as the loss of a transmission line or generator • A key focus of this course is the control capability to meet these requirements
Power Systems Operate on Many Time Scales electromagnetic transients induction motor dynamics generator/excitation dynamics machine-network interaction prime mover control mechanically switched capacitors/reactors SVC generator inertial dynamics DC first swing transient stability protective relaying 10-6 10-5 10-4 10-3 10-2 0.1 1 10 time, sec
Power Systems Operate on Many Time Scales load/power transfer increase OLTC transformer & distribution voltage regulator prime mover control load diversity thermostat control excitation limiting gas turbine start-up powerplant operator actions generation change/AGC boiler dynamics line/transformer overload system operator actions DC converter OLTC protective relaying including overload protection 100 10,000 10 1,000 time, sec
steady state operations steady state contingencies planning horizon operations horizon Power System Operation Regimes operator response automatic system response disturbance response transients time hours; days; months minutes seconds
Course Objectives • Acquaint students with some key analytical aspects of large-scale systems • Stress the importance of problem formulation • Expose students to some of the major considerations in the design and operation of large-scale systems • Equip students with skills to read the relevant literature on analytical and computational techniques • Develop practical skills in solving these types of problems • Learn how to use example commercial software
Key Perspectives • Large – scale system • Highly nonlinear • System point of view • Importance of focus on the phenomenon(a) of interest • modeling • assumptions • Algorithmic orientation • Application of optimization, numerical analysis, circuits and systems • Guiding motto: “All models are wrong but some are useful,” George Box, 1979
Static Power System Analysis • One of the most common power system analysis tools is the power flow, which tells how power flows through a power system in the quasi-steady state time frame • The power flow can be used to model the full, three-phase system, but usually (practically always) for transmission system analysis the system is assumed to be balanced. Hence a per phase equivalent model is used.
Power System Component Models: Transmission Lines • Power flow timeframe models for common power system devices, including transmission lines, transformers, generators and loads, are developed in the prerequisite course ECE 476. • Transmission lines will be modeled using the p circuit
Power System Component Models: Transformers • Transformer equivalent model
Power System Component Models: Loads • Ultimate goal is to supply loads with electricity at constant frequency and voltage • Electrical characteristics of individual loads matter, but usually they can only be estimated • actual loads are constantly changing, consisting of a large number of individual devices • only limited network observability of load characteristics • Aggregate models are typically used for analysis • Two common models • constant power: Si = Pi + jQi • constant impedance: Si = |V|2 / Zi
Power System Component Models: Generators • Engineering models depend upon application • Generators are usually synchronous machines • For generators we will use two different models: • a steady-state model, treating the generator as a constant power source operating at a fixed voltage; this model will be used for power flow and economic analysis • a short term model treating the generator as a constant voltage source behind a possibly time-varying reactance
Per Phase Calculations • A key problem in analyzing power systems is the large number of transformers. • It would be very difficult to continually have to refer impedances to the different sides of the transformers • This problem is avoided by a normalization of all variables. • This normalization is known as per unit analysis
Per Unit Conversion Procedure, 1f • Pick a 1f VA base for the entire system, SB • Pick a voltage base for each different voltage level, VB. Voltage bases are related by transformer turns ratios. Voltages are line to neutral. • Calculate the impedance base, ZB= (VB)2/SB • Calculate the current base, IB = VB/ZB • Convert actual values to per unit Note, per unit conversion on affects magnitudes, not the angles. Also, per unit quantities no longer have units (i.e., a voltage is 1.0 p.u., not 1 p.u. volts)
Per Unit Solution Procedure • Convert to per unit (p.u.) (many problems are already in per unit) • Solve • Convert back to actual as necessary
Per Unit Example Solve for the current, load voltage and load power in the circuit shown below using per unit analysis with an SB of 100 MVA, and voltage bases of 8 kV, 80 kV and 16 kV. Original Circuit