Download
1 / 17
170 likes | 272 Views
AURIGA-LIGO Activity. F. Salemi Italy, INFN and University of Ferrara for the LIGO-AURIGA JWG 2nd ILIAS-GW Meeting, October 24th and 25th, Palma de Mallorca , 2005. Outline. First LIGO-AURIGA coincidence search:

E N D
AURIGA-LIGO Activity F. Salemi Italy, INFN and University of Ferrara for the LIGO-AURIGA JWG 2nd ILIAS-GW Meeting, October 24th and 25th, Palma de Mallorca , 2005
Outline • First LIGO-AURIGA coincidence search: • setting up methodologies for joint observations between bars and interferometers • data selection and validation • description of the tuning procedure for the network analysis and preliminary estimate of how the tuning affects detection efficiency and accidental coincidence background • preliminary evaluation of the network efficiency via injections of simulated signals LIGO S3 run: Oct 31 2003 – Jan 9 2004 AURIGA run 331: Dec 24 2003 – Jan 14 2004 October 24th 2005, Palma de Mallorca
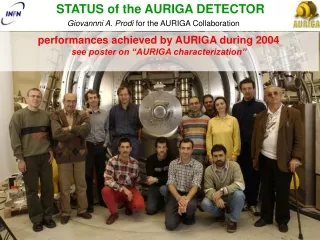
Sensitivity Spectra • Best performance during the 331 and the S3 run: • LIGO S3: large rate of transients, noise variability • AURIGA run 331: poor data quality (un-modeled excess noise) • Main scope of analysis of this data set: study of IFO-bar methodologies on actual data. single-sided PSD October 24th 2005, Palma de Mallorca
Data Selection Criteria • LIGO’s data selection criteria • Applied all data quality flags selected for the S3 LIGO-only analysis (e.g. exclude periods of high seismic activity, dust in enclosures, timing errors, DAQ overflow) LIGO data-analysis • Require all three (two) interferometers in operation triple (double) coincidence • The veto implemented on the AURIGA side to compensate run-specific effects and the correspondent loss in live time • Wide-band glitches 4% • Epoch veto based on Monte Carlo detection efficiency 42% October 24th 2005, Palma de Mallorca
Observation time LIGO S3 run: Oct 31 2003 – Jan 9 2004 AURIGA run 331: Dec 24 2003 – Jan 14 2004 Coincident Run 389 hr Coincidence run (after removal of 10% playground data set) 352 hr Exchanged data: LIGO H1-H2-L1 triple-coincidence (with DQ flags) (-84%) 61 hr LIGO H1-H2 double coincidence (with DQ flags)(-50%) 193 hr AURIGA net of wide-band (-4%) and epoch veto(-42%) 211 hr Intersection: AU-H1-H2-L136 hr AU-H1-H2110 hr October 24th 2005, Palma de Mallorca
Analysis method (method 2) • No assumption on direction, minimal assumptions on waveform (e.g. duration, signal with some power in AURIGA band). • The r-statistic test (within CorrPower) is applied to the LIGO interferometers around the time of the AURIGA triggers. • hrss at each LIGO detector is estimated with the burst parameter estimation code (Note: this portion of the analysis is not mature for presentation) • Efficiency for classes of waveforms and source population is performed through Monte Carlo simulation, via software injected signals. • The accidental rate (background) is estimated from “off-source” data sets, where LLO and LHO data streams are independently time-shifted with respect to the AURIGA data stream. October 24th 2005, Palma de Mallorca
Thresholds • AURIGA: for the analysis of run 331 data, the exchange threshold is SNR > 4.5. This threshold would ensure a satisfactory significance of the candidate events in Gaussian noise, but this is not the case for the noise performance of run 331: under these conditions a more suitable threshold for IGEC-style searches would have been SNR>7. • LIGO: from first principles, events with G<=3 in Gaussian noise are consistent with the null hypothesis (no correlation) at the 0.1% level or higher: these events can already be discarded. S3 was a “glitchy” run (the LIGO-only used the threshold G0 = 10 !); we decided to use as starting point/minimal threshold that of S2 (G0 = 4). • The tuning procedure will establish which direction we need to move away from these minimal thresholds. The tuning procedure is still in progress: we have explored 4-detector coincidences and are working on the AU-H1-H2 triple coincidence. We reserve to freeze thresholds after we have explored both sectors and remain blind to the final result until that point. In order to exemplify the procedure, today we will discuss background and detection efficiency for a sample waveform and a trial set of thresholds and how these quantity are affected by the thresholds choice. October 24th 2005, Palma de Mallorca
Diagnostic plots ofAURIGA triggers • AURIGA trigger generation: delta matched filter. • Events characterized by time, its uncertainty, H, SNR • σt < 45ms (worst case, for SNR=4.5), typical ~ 10ms (average for exchanged events) Rate [Events/1 min] Rate (SNR>4.5) vs “live hours” in the AURIGA dataset • AURIGA SNR vs time • red=all exchanged data • blue=AU-H1-H2-L1 October 24th 2005, Palma de Mallorca
LIGO events • Apply r-statistic test in CorrPower • Test 3-ifo correlation in LIGO data around: AURIGA event arrival time ± event time uncertainty ± 27 ms (=flight time) • Correlation windows: 20, 50,100 ms 99% overlapping • Use G to make a statement on the coherence among the 3 LIGO interferometers. • Impose H1-H2 consistency criteria: • Sign of the H1-H2 correlation: R0 cut • Amplitude cut between H1 and H2 (800-1000 Hz vs broadband? This is not in a mature state, but is already showing promising results in the rejection of background events) October 24th 2005, Palma de Mallorca
Testing correlation of LIGO (lagged) data around the time of AURIGA triggers • AURIGA SNR • red=all exchanged data N=182515 • blue=AU-H1-H2-L1 N=31676 LIGO G (49 lags, AU-H1-H2-L1) • 1.4 million triggers in the background dataset • 96 triggers above minimal thresholds + R0 cut Triggers below SNR=4.5 are not exchanged Minimal thresholds A background set reserved for tuning purposes: 49 time lags among AU, LLO and LHO No H1-H2 consistency cuts applied yet October 24th 2005, Palma de Mallorca
Tuning Summary Plot (2-d ROC) using Sine/Cosine Gaussians (νc=900Hz Q=8.9) Preliminary background events contour lines are conservative: ongoing studies of H1-H2 amplitude cut are promising for suppression of false events. The response is dominated by AURIGA sensitivity/noise: better increase LIGO threshold to suppress false alarms and preserve efficiency Trial threshold for illustration October 24th 2005, Palma de Mallorca
Efficiency curve for sine/cosine gaussians with trial set of tuning parameters Efficiency curve for the joint analysis, dominated by AURIGA: 50% efficiency at ~5.5e-20 Hz-0.5 LIGO only at 850Hz: Waveburst ETG Γ0=10 hrss_50% =2.3e-20 Hz-0.5 Tuning tests performed so far indicate that the efficiency curve changes by at most 10% as the tuning parameters are changed in the range that is being considered. AURIGA TH = 4.5 G0 = 6 is not critical for the efficiency (see tuning plot) Preliminary studies on the introduction of an H1-H2 amplitude cut would give at most a 5-10% loss in hrss_50%. AURIGA at 900 Hz: δ-filter ETG with TH=7 hrss_50%=7.5e-20 Hz-0.5 (suitable threshold for IGEC-like searches on run 331) October 24th 2005, Palma de Mallorca
Present & Near Future • Complete the “all-sky” S3-run331 coincidence analysis: • Complete characterization and implementation of an H1-H2 amplitude cut for false events suppression. • Repeat analysis of triple coincidence AU-H1-H2 • Fix thresholds and open the box for zero-lag coincidences • Increase the level of coordination between the g.w. detectors: • Meeting at MIT October 6-7, 2005: LIGO + Bars • Data acquisition status page => http://www.ldassw.ligo.caltech.edu/ligotools/runtools/gwistat/ (Credits to Peter Shawhan and Stefano Longo) October 24th 2005, Palma de Mallorca
More AURIGA diagnostics Auto-coincidence in recent run May05 Auto-coincidence in run 331 20 sec “bump” SNR>4.5 SNR>4.5 SNR>5 SNR>6 • Auto-coincidences • (100 ms window) • Evident clusterization of AU exchanged events • Plateaux reached at ~ 300 sec • Bump at 20 sec disappears increasing the SNR threshold • Comparison with a recent run SNR>7 October 24th 2005, Palma de Mallorca
Simulated Waveforms Fourier transform of simulated waveforms, normalized to total signal energy=1 • The sources are distributed isotropically over the sky with random polarization: • Sine gaussians and cosine gaussians with νc =900 Hz and Q=9 (τ = 2.2 ms) • Gaussians with τ= 0.2 ms • Damped sinusoids with νc = 930 Hz and damping time τ = 6 ms. • In the next slides, we focus on Sine/Cosine Gaussians only. October 24th 2005, Palma de Mallorca
MDC Injections + Table • The sources are distributed isotropically over the sky with random polarization: • Sine gaussians and cosine gaussians with νc =900 Hz and Q=9 (τ = 2.2 ms) • Gaussians with τ= 0.2 ms • Damped sinusoids with νc = 930 Hz and damping time τ = 6 ms. • In the next slides, we focus on Sine/Cosine Gaussians only. Using trial thresholds: SNR>4.5 G>6 October 24th 2005, Palma de Mallorca