Download
1 / 48
480 likes | 570 Views
Climate Trends in the Corn Belt. Eugene S. Takle Professor Department of Agronomy Department of Geological and Atmospheric Science Director, Climate Science Program Iowa State University Ames, IA 50011. Carbon, Energy, and Climate Conference

E N D
Climate Trends in the Corn Belt Eugene S. Takle Professor Department of Agronomy Department of Geological and Atmospheric Science Director, Climate Science Program Iowa State University Ames, IA 50011 Carbon, Energy, and Climate Conference Michigan State University W. K. Kellogg Biological Station Hickory Corners, MI 27 September 2012
Outline • Recent changes in climate of the Midwest • Focus on extremes • Producer adaptation to climate change • Future projections of extreme precipitation
Des Moines Airport Data Caution: Not corrected for urban heat island effects
Des Moines Airport Data Caution: Not corrected for urban heat island effects
Winter Temperatures are Rising, Fewer Extreme Cold Events Des Moines, IA Des Moines, IA
Des Moines Airport Data 1983: 13 1988: 10 1977: 8 1974: 7 6 days ≥ 100oF in the last 23 years
Des Moines Airport Data 8 days in 2012 1983: 13 1988: 10 1977: 8 1974: 7 6 days ≥ 100oF in the last 23 years
Iowa State-Wide Average Data 34.0” 10% increase 30.8”
Iowa State-Wide Average Data Totals above 40” 2 years 34.0” 10% increase 30.8”
Iowa State-Wide Average Data Totals above 40” 8 years 2 years 34.0” 10% increase 30.8”
Cedar Rapids Data 32% increase 28.0” 37.0”
Cedar Rapids Data Years with more than 40 inches 11 1 32% increase 28.0” 37.0”
“One of the clearest trends in the United States observational record is an increasing frequency and intensity of heavy precipitation events… Over the last century there was a 50% increase in the frequency of days with precipitation over 101.6 mm (four inches) in the upper midwestern U.S.; this trend is statistically significant “ Karl, T. R., J. M. Melillo, and T. C. Peterson, (eds.), 2009: Global Climate Change Impacts in the United States. Cambridge University Press, 2009, 196pp.
Cedar Rapids Data 67% increase 3.6days 6.0 days
Cedar Rapids Data Number of Years with More than 8 Occurrences: 0 => 9 0 9 67% increase 3.6days 6.0 days
Number of Years with More than 8 Occurrences: 2 => 7 7 2 5.2days 3.8days 37% increase
Estimates for Future Numbers of Days Per Year With Precipitation Exceeding 1.25” Based on the Gumbel Extreme Value Distribution using data from 1991-2010 assuming a stationary climate over that period. Return Periods for Years With X Days Having > 1.25” w 10% incr mean 12 days 6.5 y 6 y 15 days 11 y 9 y 20 days 29 y 22 y 22 days 42 y 30 y
Amplification of the Seasonality of Precipitation Spring Fall Winter Summer
Amplification of the Seasonality of Precipitation Spring Fall Winter Summer
Amplification of the Seasonality of Precipitation Spring Fall 21.2 => 25.3 inches (22% increase) 12.1 => 10.5 inches (13% decrease) Winter Summer
Mean Summer (JJA) Dew-Point Temperatures for Des Moines, IA Rise of 3oF in 42 years 12% rise in water content in 42 years
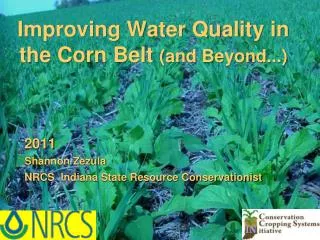
Iowa Agricultural Producers are Adapting to Climate Change: • Longer growing season: plant earlier, plant longer season hybrids, harvest later • Wetter springs: larger machinery enables planting in smaller weather windows • More summer precipitation: higher planting densities for higher yields • Wetter springs and summers: more subsurface drainage tile is being installed, closer spacing, sloped surfaces • Fewer extreme heat events: higher planting densities, fewer pollination failures • Higher humidity:more spraying for pathogens favored by moist conditions. more problems with fall crop dry-down, wider bean heads for faster harvest due to shorter harvest period during the daytime. • Drier autumns:delay harvest to take advantage of natural dry-down conditions, thereby reducing fuel costs HIGHER YIELDS!! Is it genetics or climate? Likely some of each.
Can we trust climate models for projecting future climate in the Midwest?What is their record so far? • NASA GISS model from 1988 projected for Iowa: • Winters will warm more than summers (true) • Nights will warm more than days (true) • Precipitation will increase (true, but probably just lucky) • Shift in precipitation seasonality toward more in the first half year and less in the second half (true) Takle, E. S., and S. Zhong, 1991: Iowa’s climate as projected by the global climate model of the Goddard Institute for Space Studies for a doubling of atmospheric carbon dioxide. Journal of the Iowa Academy of Science 98 (4), 153-158.
Iowa State-Wide Average Data Totals above 40” 8 years 2 years 34.0” 10% increase 30.8”
Iowa State-Wide Average Data Totals above 40” 8 years 2 years 5years 3years 2012? Totals below 25”
Cedar Rapids Data Number of Years with More than 8 Occurrences: 0 => 9 Number of Years with Less than 3Occurrences: 13 => 5 0 9 5 13 22
Number of Years with More than 8 Occurrences: 2 => 7 Number of Years with Less than 3 Occurrences: 16 => 9 7 2 16 9
Future Variability in Growing Season Precipitation for Iowa More extreme floods More extreme droughts CJ Anderson, ISU
Future Variability in Growing Season Precipitation for Iowa More extreme floods Lines drawn by eye More extreme droughts CJ Anderson, ISU
Can we trust climate models for projecting future climate in the Midwest?What is their record so far? • NASA GISS model from 1988 projected for Iowa: • Winters will warm more than summers (true) • Nights will warm more than days (true) • Precipitation will increase (true, but probably just lucky) • Shift in precipitation seasonality toward more in the first half year and less in the second half (true) Takle, E. S., and S. Zhong, 1991: Iowa’s climate as projected by the global climate model of the Goddard Institute for Space Studies for a doubling of atmospheric carbon dioxide. Journal of the Iowa Academy of Science 98 (4), 153-158.
Summary • Climate of the Midwest has an underlying warming in all seasons • Higher precipitation of the last 40 years has suppressed daily max temperatures in summer; dry summers in the future will unmask this underlying warming • Frequency of precipitation extremes has increased • Future projections indicate higher frequency of both floods and droughts
For More Information: • Climate Science Program • Iowa State University • http://climate.engineering.iastate.edu/ • http://www.meteor.iastate.edu/faculty/takle/ • gstakle@iastate.edu
Impacts of Climate Change on Animal Agriculture • Decreased weight gain in meat animals • Decreased egg production in poultry operations • Decreased milk production in dairy operations • Decreased breeding success in animal agriculture • Increase in sickness and disease
Results of Iowa Extension Service Annual Farm Survey* • 2011 Iowa Farm and Rural Life Poll, an annual survey of Iowa farmers: 1,276 farmers • While 68% of Iowa farmers believe climate change is occurring, less than 45% believe humans are at least half responsible. Because of this a majority of farmers see little need to mitigate the causes of climate change. • Majority (53%) of Iowa farmers consider agriculture extension to be a trusted source of information on climate change • Less than a majority (41%) trust scientists on climate change (although scientists are second to extension personnel as a trusted source) *https://store.extension.iastate.edu/ItemDetail.aspx?ProductID=13717
Results of Iowa Extension Service Annual Farm Survey* • 2011 Iowa Farm and Rural Life Poll, an annual survey of Iowa farmers: 1,276 farmers • While 68% of Iowa farmers believe climate change is occurring, less than 45% believe humans are at least half responsible. Because of this a majority of farmers see little need to mitigate the causes of climate change. • Majority (53%) of Iowa farmers consider agriculture extension to be a trusted source of information on climate change • Less than a majority (41%) trust scientists on climate change (although scientists are second to extension personnel as a trusted source) *https://store.extension.iastate.edu/ItemDetail.aspx?ProductID=13717
Results of Iowa Extension Service Annual Farm Survey* • 2011 Iowa Farm and Rural Life Poll, an annual survey of Iowa farmers: 1,276 farmers • While 68% of Iowa farmers believe climate change is occurring, less than 45% believe humans are at least half responsible. Because of this a majority of farmers see little need to mitigate the causes of climate change. • Majority (53%) of Iowa farmers consider agriculture extension to be a trusted source of information on climate change • Less than a majority (41%) trust scientists on climate change (although scientists are second to extension personnel as a trusted source) As climate change intensifies and adaptation becomes more of a challenge, producers will look to USDA for help *https://store.extension.iastate.edu/ItemDetail.aspx?ProductID=13717
Related Activities • Climate and Corn-based Cropping System CAP (CSCAP). USDA NIFA project 2011-68002-30190. http:/www.sustainablecorn.org: developing science-based knowledge (on carbon, nitrogen, and water) that addresses climate mitigation and adaptation, informs policy development, and guides on-farm, watershed level and public decision making in corn-based cropping systems • Useful to Usable (U2U): Transforming Climate Variability and Change Information for Cereal Crop Producers. USDA NIFA project 2011-68002-30220. http:/www.AgClimate4U.org: Improving the resilience and profitability of farms amid variable climate changes by providing stakeholders with enhanced decision support tools
Climate-Informed Decision Cycle: Example - Corn Production in the Midwest Draft Version E.S. Takle