Download
1 / 38
380 likes | 643 Views
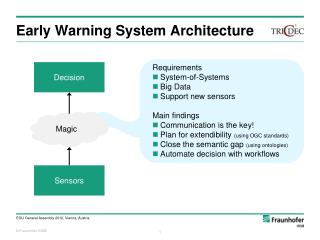
Developing a Statewide Early Warning System. Doug White, DPI Jared Knowles, DPI. Executive Summary. Statewide Longitudinal Data Systems enable a new type of EWS Wisconsin DPI has developed such an EWS, and will deploy it statewide in 2013; pilot next month

E N D
Developing a Statewide Early Warning System Doug White, DPI Jared Knowles, DPI
Executive Summary • Statewide Longitudinal Data Systems enable a new type of EWS • Wisconsin DPI has developed such an EWS, and will deploy it statewide in 2013; pilot next month • The DPI EWS is fully modular, open source, and extensible • When you can have it?
DPI’s System is in Development • More than 60% of studentswho eventually do not graduate after 4 years of high school can be identified with current data before the start of 7th grade • DPI is working to improve this through better techniques to allow students to be identified earlier and with more accuracy • The system will continually improve with better data, better mathematical models, and more real time results
Early Warning System • Early: Identify students at risk soon enough to allow time for effective interventions • Warning: Provide sense of possible negative outcomes to a student, not absolute • System: A cycle of identification, intervention, evaluation, and learning—continuous feedback loops
Why early is so important! • Earlier interventions are more effective and less costly • More planning time and careful consideration can be made with earlier warning • Parents can use info to support students during key middle grades • Students can exit at any time during high school, but in middle school exit is much more difficult
Why now? • Finally have enough longitudinal data to observe students in both middle school and through completion of high school to draw comparisons • Consistent measures statewide allow a full picture • Part of our State Superintendant’s agenda! • Statewide data means many more patterns of student outcomes prior to graduation / non-completion can be combined and analyzed
Knowledge LOCAL KNOWLEDGE STATE DATA Teacher / program context Parent input Special circumstances CONTEXT Assessments Demographics Intervention Strategies Attendance Disciplinary Events Mobility Location Student Risk Identification
Can that work? • More than 60% of studentswho do not graduate after 4 years of high school can be identified with current data before the start of 8th grade • DPI is working to improve this through better techniques to allow students to be identified earlier and with more accuracy • The system will continually improve with better data, better mathematical models, and more real time results • This system will be piloted in March 2013, and will be fully operational September of 2013 in Wisconsin, statewide
DPI DEWS Features • Free and Open Source Platform • Fully modular • Empirically Derived • Flexible • Extensible
Free and Open Source • A key feature of the DPI DEWS is that it is built on free and open source technologies • It is a series of 5 modules: • Data import • Data recoding / cleaning • Model selection • Prediction • Data Export • It has some pre-requisites to work
Technologies • The EWS is written for the R open-source statistical computing language • It is a series of modular scripts that perform some basic functions and may not be necessary everywhere • Each module expects data in certain formats and returns data in a specific format • This is entirely local to Wisconsin currently, but improvements made during the pilot phase should allow time to generalize it more
Data Import • Extract raw data from an Oracle data warehouse • Extract needs all records for a grade of students from grade 7 to graduation • Extract will be reused to get data on current grade 7 students for prediction
Data Recoding and Cleaning • Data recoding is the only place that decisions are forced on the statistical model • Administrative records need to be reshaped in a way to fit the statistical procedures • Business rules need to be in place to enforce standardization of fields • Example: FRL is coded as “F”, “R”, “N”, “A”, “P” • Need to reduce this to “F” and “N” or “F”, “R”, and “N” • Use business rules from the Strategic Data Project • Enforce some rules to make statistical model easier to fit (grouping categories to increase cell size)
Model Selection • Fit a basic statistical model regressing a subset of the data on students in 7th grade on an indicator of whether or not they graduated • More variables are added to the model, and the prediction rate of each successive model is evaluated on a test set of data • Finally, when all variables have been exhausted, or the best possible prediction rate has been achieved, the process is stopped • This is repeated for other classes of models / functional forms until the best model from the best of each class is identified
Model Selection • Depending on the data available, the factors included in the model will change, as will their weight in predicting the outcome • The system is flexible to this, so it can expand as new data comes online, and as more longitudinal data is available on cohorts • For now, in Wisconsin, for two cohorts, these factors seem to matter • Assessments — Attendance — Mobility — Discipline • School of attendance
ROC Curve Receiver Operating Characteristic (ROC): A measure of signal to noise in binary classification. http://en.wikipedia.org/wiki/Receiver_operating_characteristic
Model Types Models Tried: • Probit (winner) • Logit • HLM • k-nearest neighbors (knn) • Gradient Boosted Machine • Random Forests Models Yet Tried: • Cubist • Support Vector Machines • Multivariate Adaptive Regression Splines • Discriminant Analysis • Neural networks • Bayesian Model Averaging Currently a manual process, automation is the next step
Prediction • Prediction is handled by determining the risk score of an individual student and the uncertainty around that score • A threshold is set above which students are flagged • Districts will see both the score and the flag • The flag is based on a predetermined level of confidence in the prediction • e.g. 50% of flagged students are true dropouts, 50% are false negatives
Reporting • Predictions are output to a data store, where they are loaded into our statewide reporting instance via ETL • Working on building the prediction module into the ETL process (easily done) • Allows the scores to be updated when new data is available • Crucial as state transitions to a Statewide Student Information System, allowing more frequent updates on data • Theoretically any reporting environment could be hooked up to the system • SAMPLE REPORTS
Requirements • Requirements • 1 cohort of students who have valid and reliable measurements of several attributes in the prediction year, and observed graduation, dropout, or transfer • Serious computing resources (depending on data size and complexity) • Preferences • Multiple measures and more than 1 cohort • No selection bias in students in the data
Flexibility • Open source code that can be viewed, modified, copied, enhanced • System is built on few assumptions; it learns from the data it is fed • Can input data from a variety of formats and output data in a variety of formats (JSON, SQL, ORACLE, CSV, etc.) • Modular—use only the pieces needed
Empirically Derived • The predictive model does not make assumptions about factors that increase or decrease risk • Searches among data provided to identify the combination of factors that provide the best prediction • Factors that matter more are given more weight, those that matter less are discarded • Depending on the data available this may dramatically change • With the data provided, the system will search for the best available model
Recap • Each student receives a score from 0 to 1 (or 0-100) representing the probability of graduation in 4 years of HS • DPI can transform this into a binary indicator (on-track, not-on-track) based on historical information about the prediction (above or below a threshold) • DPI can work on calibrating this binary indicator
Contact Information Jared Knowles E-mail : jared.knowles@dpi.wi.gov Web : www.jaredknowles.com Twitter : @jknowles Questions & DISCUSSION