Download
1 / 21
210 likes | 388 Views
Making Family Outcome Data Representative of the State. Monday, August 27, 2007 Rosanne Griff-Cabelli rosanne.griff-cabelli@state.de.us Sue Campbell susan.campbell@state.de.us Delaware Birth to Three Early Intervention System. Purpose of the Original Family Survey.

E N D
Making Family Outcome Data Representative of the State Monday, August 27, 2007 Rosanne Griff-Cabellirosanne.griff-cabelli@state.de.us Sue Campbellsusan.campbell@state.de.us Delaware Birth to Three Early Intervention System
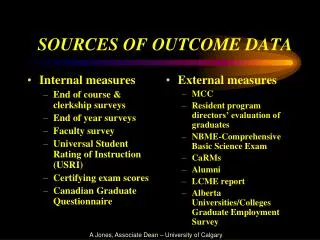
Purpose of the Original Family Survey • The survey was conducted in order to • obtain information about families’ perceptions of and satisfaction with services they received from the Child Development Watch Program (CDW) • determine families’ satisfaction with the CDW office facilities and staff interactions • determine the impact of CDW and Birth to Three services on families’ quality of life
Topics Addressed in the Original Family Survey • Did parents think their ability to parent theirchild with a disability improved? • Did parents think their child(ren)’s development improved? • Did parents feel that CDW was responsive to their needs? • Did parents feel that they had input into the services their children received? • Were families satisfied with CDW and staffinteractions? • Did CDW services have a positive impact onfamilies’ quality of life?
2006 Family Outcomes to be Assessed Outcome 1:Families know their rights and advocateeffectively for their child Outcome 2:Families Understand their child’s abilitiesand special needs Outcome 3:Families help their child develop and learn
Reasons for a Pilot OSEP Family OutcomesDevelop and integrate OSEP outcomesquestions into existing survey Expand responses for existing survey itemsFrom a three point response to a six pointresponse Test strategy of telephone interview for surveyingfamilies
Developing the New Family Survey • Delaware Ongoing Program Evaluation • Committee (OPEC) made recommendations: • Added questions to increase depth and range of response for the three family outcomes • Responses reported as single questions and by clusters– look at trends since 1999 • Expand responses of the existing survey froma range of three to a range of sixBEFORE: Yes; Less than I’d Like; NoAFTER: Very strongly agree; Strongly agree; Agree; Disagree; Strongly disagree; Very strongly disagree
Piloting the New Family Survey • Conducted in Fall 2005 • Telephone contact • families randomly selected • letter sent to families before calls made • Calls made during day and evening
Gender (child’s)26 male(53%)22 female (45%) Race/Ethnicity38 Caucasian (79%)7 AfricanAmerican (15%)1 Hispanic (2%)1 Asian (2%)1 Not Reported (2%) Family Income11 >$100,000 (23%)19 $50-100,000 (41%)9 $20-49,999 (19%)6 <$20,000 (13%)2 Not Reported Location24 New Castle County (49%)25 Kent or Sussex County (51%) Demographics of 2005 Telephone Pilot Family Survey Respondents (N=49)
2005 Federal Outcomes Measures Internal Consistency
Pilot resulted in the following: • Questions from pilot found appropriate for use • Better to use telephone survey than mail distribution method • Stratified sample rather than random sample
2006 Telephone Interviews with Families • Representative sample is predetermined byinformation in data system (ISIS) • Geographic region • Race/ethnicity • Length of time in CDW (state focus) • Sample matrix currently includes 12 data cells • Each cell contains 30 families to be sampled • Total of 360 families to be sampled Can always add specific demographics if need to focus on specific populations Small cell size
Number of Families by Region, Ethnicity, and Months in CDW • Received list of 976 families in CDW • 684 in New Castle County (CDW North) • 292 in Kent and Sussex Counties (CDW South)
Before the Telephone Interviews… • 850 of these families were mailed: • a cover letter explaining the purpose of the interview • an information sheet describing • the usefulness of family feedback • assurances of confidentiality • examples of some information that would be asked • additional contact numbers if families had questions about the interview
Number of Letters Mailed by Region, Ethnicity, and Months in CDW (N=850)
Letters Mailed and Return Rate • Telephone calls were made to all of the families from the original list, unless letters were returned due to incorrect addresses, until 224 families had completed the Family Survey. • The families were contacted between one and four times. • Calls would be made during the day, in the evenings, and on the weekends • Reasons families were not contacted via telephone: • Telephone was disconnected • Number was wrong • Families were found not to meet the criteria for completing the telephone interview
Reasons why Families were not Contacted • Reasons families were not contacted via telephone: • 97 Telephone was disconnected (35.4%) • 63 Number was wrong (23.0%) • 59 Mail returned (21.5%) • 28 No phone number listed (10.2%) • 9 Less than six months in CDW (3.3%) • 5 Phone not in service (1.8%) • 14 Other reasons (5.1%)275 families
How did Delaware Determine Family Outcome Data is Representative? • Contract with the Center for Disabilities Studies, University of Delaware to moderate biased response • Sample according to demographics of Annual Child Count
Conclusions • The expanded response possibilities allows for deeper analysis of families’ responses (move to 6 point scale) • The telephone survey allows for individual responses and clarification of questions • The telephone survey allows for the immediateidentification of the sample demographics, and allows for targeting of underrepresented categories. Data collection will continue until all categories are appropriately represented • The telephone survey also allows for immediatefeedback as to why families chose not to participate and the demographics of who chose not to participate
Lessons Learned for Efficient Family Surveying and Adequate Representation • Contact families at various times of the day within a shorter timeframe (1-2 weeks) rather than making multiple attempts at a larger timeframe. • Request updated information from CDW offices to contact families who have disconnected phone numbers, no telephone numbers or wrong telephone numbers. If phone number still not available, mail survey. • Send a follow-up letter to families asking families to call back to schedule an interview