Download
1 / 18
180 likes | 295 Views
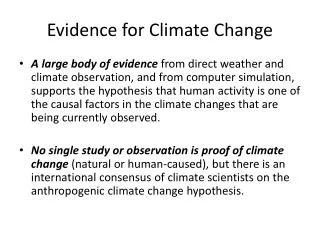
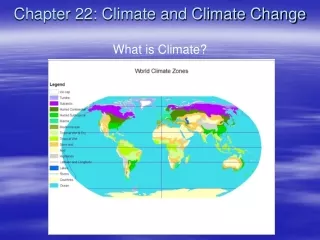
Chapter 2. Evidence for Climate Change. HNRS330 Dr. Hengchun Ye.

E N D
Chapter 2. Evidence for Climate Change HNRS330 Dr. Hengchun Ye
Since 1880, the global mean annual air temperature has increased approximately 0.8°C (1.4°F) due to increased greenhouse gases in the atmosphere. Because of this, scientists have observed widespread changes in climate, which in turn are causing significant changes in Earth’s environments and ecosystems.
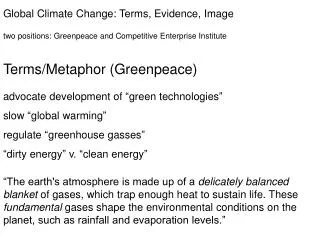
On a typical day, we lose • 300KM2 of forest to logging (one acre per second) • 186 KM2 to encroaching deserts We gain • Population by more than 200,000 • 100 million tons of CO2 Our planet is perched on the edge of a tipping point, a planetary-scale critical transition as a result of human influence. CO2 can reside in the atmosphere for 1000 years, so the climate change caused by CO2 is irreversible for the next 1000 years.
National Academy of Sciences: it is “settled fact: that the earth system is warming, there is 90% to 99% probability that humans are the cause. A consequence of deforestation, industrial agriculture, manufacturing, and other human activities that increase the concentration of greenhouse gases. What are 6 greenhouse gases? NASA: the National Aeronautics and Space Administration GISS: Goddard Institute for Space Studies NOAA: National Oceanic and Atmospheric Administration World Meteorological Organization United Nation’s Environmental Program IPCC: intergovernmental Panel of Climate Change; Its primary role is publishing special reports on topics relevant to the implementation of the United Nations Framework Convention on Climate Change, which is an international treaty that acknowledges the possibility of harmful climate change. The IPCC is organized in three working groups: Working Group I reports on the physical science basis of climate change; Working Group II reports on climate change impacts, adaptation, and vulnerability; and working Group III reports on mitigation of climate change. The U.S. Global Change research Program
Temperature Scales • Temperature Scales • freezing broiling • Fahrenheit 32°F 212°F • Celsius 0°C 100°C • Kelvin 273°K 373°K
Temperature: • In 2010 the average temperature on Earth’s surface tied with 2005 as the warmest yeast since record keeping begin in 1880. • The first decade of the 21st century was the warmest decade • During the past three decades, Earth’s surface temperature has trended upward about 0.2C° (0.36°F) per decade • Short-term variability versus long term trend • Global warming is a “noisy” process that requires analysis of both short term and the long term trends • July2012 marked that hottest month in US history, drought expanded to 63% of the contiguous US. Extreme hot temperature covered about 0.1-0.2% of the globe from 1951-80, now cover about 10% of the globe • NASA scientist James Hansen: these record-breaking events are the logical result of global warming Nine of the 10 warmest years since 1880 have occurred since 2000, as Earth has experienced sustained higher temperatures than in any decade in recorded history. As greenhouse gas emissions and atmospheric carbon dioxide levels continue to rise. Scientists expect the long-term temperature increase to continue as well
Precipitation the source of drinking water, cause of flooding, governing ecosystems that provide us the natural resources • Atmospheric water holding capacity increases about 7% per each degree of warming (larger amount of increases at higher temepratures) • Increases in moisture increases intensity of storms-flooding • Warmer Air: increased evapotranspiration, thus increases intensity and duration of drought • Wet places gets wetter and dry places gets drier • Decreased snowfall, increased rainfall led to earlier snowmelt-increased flooding in later winter and early spring-increases probability of drought in summer
Future Changes More: Abnormally hot days and nights, heat waves, precipitation extremes, droughts, hurricane intensity, strong cold-season storms, coastal erosion at Alaska and Canada, glacier melting, ocean water acidity, dissolved oxygen in oceans, Less: Cold days and nights, number of frost days, less frequency of precipitation, sea ice cover, water supply, snow cover, permafrost. Tree lines migrating north and higher elevation, spring comes earlier, species are moving polar ward and to higher elevation, global water cycle accelerates, storm tracks shifting poleward, accelerated sea level rising
Climate Data: In U.S, climate data are collected maintained, and analyzed by the NASA Goddard Institute of Space Studies (GISS) and the National Oceanographic and Atmospheric Administration (NOAA). Both work closely with governments and researcher worldwide. In the United Kingdom, the Met Office Hadley Center (UPMET) is the foremost climate change research center, with responsibility to collect and analyze global climate information In Japan: the Japan Meteorological Agency provides weather observation and forecasting an climate change and global environmental tracking services. Researchers at universities, government offices, and institutions around the world conduct scientific investigations and publish results in peer-reviewed journals and reports..
How unusual is the present warming? Unprecedented warming: in both magnitude and speed Arctic amplification: arctic is responding more rapidly to global warming than most other areas on our planet. (warming has overpowered natural climate pattern of cooling in the Arctic). The global temperature rise in the past few decades is unprecedented in the context of the last 1600 years. Larger trend in more recent decades indicating accelerated warming In 1940s-70s, the industrialization following the World War II increased pollution in the NH, contributing to cooling by blocking sunlight. Top: satellite data
Results from Independent sensors (remote sensing technology) Trapping heat in lower troposphere would lead to cooling of the stratosphere Greenhouse emissions are responsible for 166% of the observed warming since 1950 (offset cooling by aerosols). Map of temperature trends 1979-2010 (C°/decade) and 12 month running mean global temperature time series with respect from 1979-1998.
Land warms up faster than Ocean • Northern Hemisphere warms up faster than southern Hemisphere?
Land–Water Heating Differences • Specific heat: the amount of heat required to increase 1 gram of substance by 1°C. (water has the highest specific heat than anything else on the earth).
Human Fingerprints • More industrial carbons: Isotopes:C-12, C13, C14; C-12 plant photosynthesis; for example, Petroleum composed largely of fossilized marine algae, coal composed of fossilized terrestrial wetland plants-contain high light carbon C-12 (or ratio of C-13/C12 is low) When oil and coal are burned, these C-12 is quickly combined with O2 to form CO2 released into atmosphere. Detecting a decreases in ratio of C-13/C12 over the past 200 years indicates the growth of CO2 in atmosphere is wholly attributable to combustion of coals and petroleum. • Less heat is escaping to space Satellites detected a decrease in the infrared energy emitted by Earth from 1970-1997. 3. Oceans are warming from the top down Ocean’s upper layer warming captured by sensors is consistent with models simulating human production of greenhouse gases (cannot be explained by any natural causes)
Fingerprints: Continue 4. Nights are warming faster than Days Absent of sun light, warming at night is contributed to greenhouse effect (long wave energy budget) 5. More heat is returning to Earth Observed increases in downward radiation (green house effect) 6. Winter is warming faster than summer Atmosphere is uniformly warming under an amplified greenhouse effect, a cool winter would be more out of equilibrium with rising temperature. 7. Stratosphere is cooling Observed by weather balloons and satellites 8. Physical Models require human greenhouse gas emission to derived the similar level of temperature
Community Resilience • Bring more vegetation into neighborhoods (improve storm water management, lower temperature, reduce CO2) • Plant community garden (reduce CO2 emission) • Use Drought-resistant landscaping • Use light-colored pavement, roofing, and other surfaces (reduce albedo-white roof can be 23°C cooler than a traditional black roof; reduce electricity-CO2). • Stop building on coastlines • Save older buildings • Follow new “Original Green Building Practices” • Keep the community footprint small and well connected • Update zoning and building codes
March Extreme 2013 From Weather Trend International Inc (Canada)