Download
1 / 10
100 likes | 222 Views
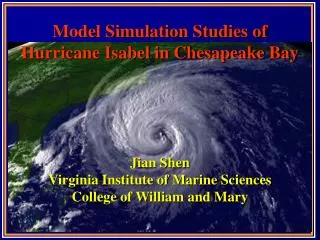
Immersive Visualization of the Hurricane Isabel Dataset. Kenny Gruchalla and Jonathan Marbach BP Center for Visualization University of Colorado at Boulder. A First Look. BP Center for Visualization. Research in Visualization and Immersive Virtual Reality www.bpvizcenter.com.

E N D
Immersive Visualization of the Hurricane Isabel Dataset Kenny Gruchalla and Jonathan Marbach BP Center for Visualization University of Colorado at Boulder
BP Center for Visualization • Research in Visualization and Immersive Virtual Reality • www.bpvizcenter.com
The Immersive Drilling Planner (IDP) • A tool for planning oil and gas wells
What does that have to do with the Contest? • We adapted the Immersive Drilling Planner (IDP) to load the Hurricane Isabel Dataset: • Added capabilities for time-varying volume and vector data • Added timestep controls • Added transfer function editing • Added data probes • …and we called it AtmosV!
The Video • Available atwww.jonmarbach.com/isabel
AtmosV and the Contest • Contest Goals • Interactivity • Exploration • Fusion • Our Solution • Immersive, Real-time visualization (Performance does matter!) • Timestep control, Real-time Text Probes and Temperature Probes, Dataset choice, Transfer function editing, Vector-plane selection • Simultaneous visualization of multiple characteristics
Challenges • Performance/Memory Tradeoff (SGI Onyx 3800 vs Cluster) • Vector Volume size (Tried using RGBA encoded vectors and Vertex Texture Fetch – card/drivers aren’t quite ready) • Vector Volume size (Tradeoff between full data integration and full timestep display) • Downsampling (Tradeoff between quality and memory footprint) • What does it mean to be Immersed in a Volume?
Acknowledgements • Geoff Dorn, Director, BP Center for Visualization • Mercury Computer Systems (TGS, OpenInventor) • NVidia • The IEEE Vis Contest Committee
Contact Information Jonathan Marbach marbach@colorado.edu Kenny Gruchalla gruchall@colorado.edu BP Center for Visualization University of Colorado Campus Box 540 Boulder, CO 80309 www.jonmarbach.com/isabel