Download
1 / 6
90 likes | 406 Views
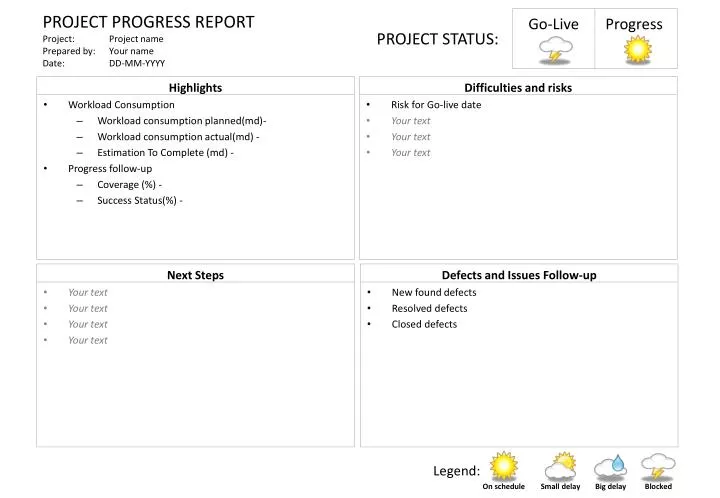
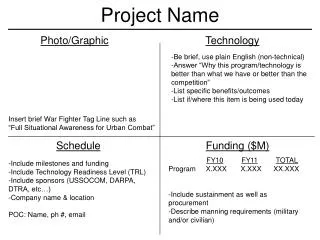
PROJECT STATUS :. Go-Live. Progress. PROJECT PROGRESS REPORT Project : Project name Prepared by : Your name Date: DD-MM-YYYY. Highlights Workload Consumption Workload consumption planned(md)- Workload consumption actual(md) - Estimation To Complete (md) - Progress follow-up

E N D
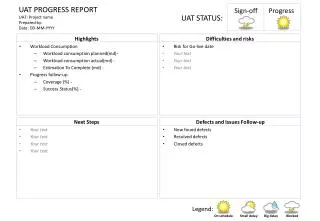
PROJECT STATUS: Go-Live Progress PROJECT PROGRESS REPORTProject: Project namePrepared by: Your nameDate: DD-MM-YYYY Highlights • Workload Consumption • Workload consumption planned(md)- • Workload consumption actual(md) - • Estimation To Complete (md) - • Progress follow-up • Coverage (%) - • Success Status(%) - Next Steps • Your text • Your text • Your text • Your text Difficulties and risks • Risk for Go-live date • Your text • Your text • Your text Defects and Issues Follow-up • New found defects • Resolved defects • Closed defects Legend: On schedule Small delay Big delay Blocked
PROJECT STATUS DASHBOARD On Schedule Medium High Go-Live Risk! ! +25% High Risk! -100% +100% Lowest Highest Actual Vs Planned Go-Live Risk PROJECT TASKS DISTRIBUTION 2140 2000 60 50 20 10 PASSED FAILED IN PROGRESS NOT STARTED ABANDONED TOTAL REMAINING WORKLOAD: E F 80% PROJECT PROGRESS TILL DD-MM-YYYY 10 20 30 40 50 60 70 80 90 100 PROJECT Kick-Off PROJECT Sign-Off 0 40% 50% PLANNED ACTUAL
PROJECT STATUS DASHBOARD On Schedule Medium High Go-Live Risk! ! +25% High Risk! -100% +100% Lowest Highest Actual Vs Planned Go-Live Risk PROJECT TASKS DISTRIBUTION 2140 2000 60 50 20 10 PASSED FAILED IN PROGRESS NOT STARTED ABANDONED TOTAL REMAINING WORKLOAD: E F 80% PROJECT PROGRESS TILL DD-MM-YYYY 10 20 30 40 50 60 70 80 90 100 PROJECT Kick-Off PROJECT Sign-Off 0 40% 50% PLANNED ACTUAL
PROJECT STATUS DASHBOARD On Schedule Medium High Go-Live Risk! ! +25% High Risk! -100% +100% Lowest Highest Actual Vs Planned Go-Live Risk PROJECT TASKS DISTRIBUTION 2140 2000 60 50 20 10 PASSED FAILED IN PROGRESS NOT STARTED ABANDONED TOTAL REMAINING WORKLOAD: E F 80% UAT PROGRESS TILL NOW (23-05-2013) 10 20 30 40 50 60 70 80 90 100 PROJECT Kick-Off PROJECT Sign-Off 0 40% 50% PLANNED ACTUAL
PROJECT STATUS DASHBOARD On Schedule Medium High Go-Live Risk! ! +25% High Risk! -100% +100% Lowest Highest Actual Vs Planned Go-Live Risk PROJECT TASKS DISTRIBUTION 2140 2000 60 50 20 10 PASSED FAILED IN PROGRESS NOT STARTED ABANDONED TOTAL REMAINING WORKLOAD: E F 80% PROJECT PROGRESS TILL DD-MM-YYYY 10 20 30 40 50 60 70 80 90 100 PROJECT Kick-Off PROJECT Sign-Off 0 40% 50% PLANNED ACTUAL
Calculations of bar sizes and angles • Actual vs. Planned dash angle calculation • 0’ is the angle where the dash is exactly in the middle, which means the project goes straight on schedule. • In case the project progress goes behind or forward the schedule the angle is calculated as a percentage of 90’ • Example: If the project goes 20% faster than planned – then the dash should be moved 20%*90’ = 18’ • Go-Live risk • It is not exactly calculated, you can decide where to put the dash, depending on the risk. If it is high – the dash points to the right side • Project tasks distribution • Total bar size 14.8 • Every other bar is calculated as a percentage of 14.8 • Project progress • Total bar size is 12.3 • Every bar is calculated as a percentage of 12.3 • Remaining workload • 0’ is the angle where the dash points into the maximum level of workload • 180’ is the angle where the dash points into the lowest level of workload remaining

![[Project Name]](https://cdn1.slideserve.com/2218758/project-name-dt.jpg)
![[Project Name]](https://cdn1.slideserve.com/2784943/project-name-dt.jpg)