Download
1 / 39
390 likes | 519 Views
Physical, Chemical, and Biological Responses to Inflow Events in the San Antonio Bay System. Stephen E. Davis, III co-PIs: Dan Roelke (TAMU) and Doug Slack (TAMU)

E N D
Physical, Chemical, and Biological Responses to Inflow Events in the San Antonio Bay System Stephen E. Davis, III co-PIs: Dan Roelke (TAMU) and Doug Slack (TAMU) Graduate students: Bryan Allison, Tim Assal, Rachel Butzler, George Gable, David Hoeinghaus, Hsiu-Ping Li, Carrie Miller, Jose-Vicente Montoya
Why study inflows to estuaries? George Ward (UT)
Why study inflows to estuaries? How much inflow does a given estuary need? When? For how long? How often? inundation FLORA materials INFLOWS salinity CONSUMERS Conceptual framework for estuarine research …and TexEMP modelling (TWDB and TPWD)
From 2002 State Water Plan Why study inflows to estuaries?
Why study multiple scales in estuaries? Spatial Scales of Consideration • Sites of interaction between Watershed-level processes and oceanographic processes • Regional climate • Tides • Watershed development • Estuarine zonation • Tide/elevation • sub-tidal to high inter-tidal • Freshwater inflow/flushing • oliogohaline to polyhaline http://tx.usgs.gov/basins.html
Why study multiple scales in estuaries? Temporal Scales of Consideration • Inter-annual variability • ENSO forcing • Disturbance regime • Watershed development • Intra-annual variability • Hydrodynamics • Anthropogenic effects • Diurnal and spring/neap • Wind forcing, storm effects • Freshwater inflow/flushing • Seasonal climate • How to characterize? • Number of pulses • Magnitude of pulses • Duration of pulses • Period between pulses
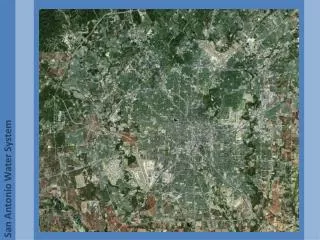
Lower Guadalupe River • Discharge and stage (USGS gauge) • Nutrient and TSS Loadings Open Water/Bays • Dataflow mapping • Water quality/ nutrients • Lower food web dynamics Marsh Studies • Water quality • Hydrodynamics • Vegetation & soils • Marsh inundation • Food Web patterns Seadrift gauge (TCOON) GBRA #1 gauge (TCOON) Guadalupe Estuary
Whooping cranes at ANWR Photo by Kristin LaFever
Sundown Bay Pump Canal Boat Ramp salinity (‰) JUN/JUL 2003 OCT/NOV 2003 FEB 2004 JUL 2004 Spatio-temporal varaibility in creek salinity 2-week salinity snapshots at three sites
Boat Ramp Pump Canal Sundown Bay ANWR tidal creek salinity June 2003–May 2005 wet year “average” year
YES, but other factors are also at work. including: upland runoff, direct precipitation, groundwater exchange, wind forcing, tides, barge traffic, etc. Do Guadalupe River inflows affect ANWR creek salinity?
datalogger ram GPS/depth temp/cond de-bubbler pump box Dataflow in Action Measures: LAT/LONG, Temperature, Conductivity/Salinity, Transmittance, Chlorophyll a, CDOM, Depth, and PAR At approximately 8 second intervals from a vessel running at 20 kts.
Tracking responses to Guadalupe River inflow events using Dataflow
Quantifying hydrologic connectivity across the marsh ponds tidal creek
Whooping cranes 93% 98% Seasonal dynamics of wolfberry 2003 2004 Number of berries
C3 succulents Spartina Salicornia Batis Carax Distictlis Wolfberry White Aster C4 grasses Borrichia Algae
Red Drum Mullet Gizzard Shad Hardhead Pinfish Black Drum Inland Silverside Spot Ladyfish Southern Flounder Brown Shrimp Blue Crab Ruppia
Spot Pinfish Black Drum Ladyfish Brown Shrimp Blue Crab Ruppia Mullet
Inland Silverside Brown Shrimp Ladyfish Floc Sailfin Molly Blue Crab Algae
Plankton incubation chamber array peristaltic pump media reservoir flow-through phytoplankton reaction chambers light box with 3 chambers temperature control bath
Mean annual flushing Zooplankton (bio-volume) and Phytoplankton (fluorescence) response to continuous vs. pulsed mode of delivery under different hydrologic flushing rates
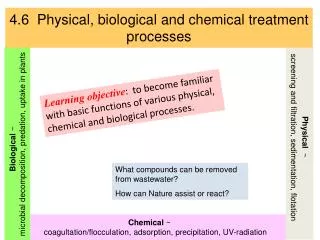
What have we learned thus far? • Large pulses affect water levels/connectivity, BUT other factors are more important during median flows. • Connectivity affects food web patterns • River inflows drive bay-wide water quality, BUT other factors may be equally important in ANWR tidal creeks. • Entire lagoonal estuary can be fresh • Marsh vegetation is sensitive to intra-annual variations in inundation and salinity. • Greenhouse studies • Water column mostly net autotrophic • Phytoplankton and zooplankton show positive response to pulsed inflows.