Download
1 / 22
220 likes | 380 Views
EU dairy policy analysis: Exploring the importance of quota rent estimates. By Research Fellow Chantal Pohl Nielsen. Why dairy ? Why quota rents ?. Dairy remains one of the most protected sectors in the EU – Price support, intervention purchases, production quotas, import tariffs,

E N D
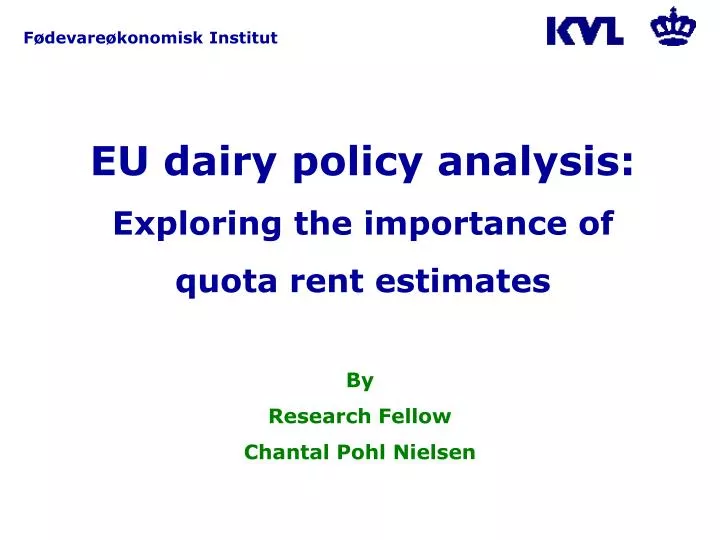
EU dairy policy analysis: Exploring the importance of quota rent estimates By Research Fellow Chantal Pohl Nielsen
Why dairy ? Why quota rents ? • Dairy remains one of the most protected sectors in the EU • – Price support, intervention purchases, production quotas, import tariffs, • TRQs, domestic consumption and export subsidies • The EU is a dominant player on world dairy markets • – 36% of production • – 27% of exports • – 14% of imports • 2003 CAP reform fine-tunes the dairy policy • – Fast-tracking certain price cuts, limiting intervention purchases, • decoupling compensatory payments • – Production quotas prolonged until 2014/15
Objective • To discuss the level of milk quota rents in the EU • – What are the correct estimates for the individual EU member countries? • – What are the underlying assumptions re. e.g. farmers’ expectations? • To illustrate the impact of using different initial quota rents • when analysing EU dairy policy reform using CGE models and to stress the • importance of recognising EU heterogeneity • To emphasise the need for further data work
Problem of unobservable marginal cost curves • Determining the size of quota rents amounts to determining whether • a country is capable of competing (unsupported) on world markets • Analytical, we’re trying to determine the position of a country’s supply • curve in an unregulated market, i.e. unobservable. • Approaches taken in the literature: • Direct: Estimates of marginal costs using farm accounts • Indirect: Quota prices (rent or lease) supplemented by assumptions • about the annual value of quota • Which real interest rate ? Length of depreciation time ? • Farmers’ expectations re. future compensation ? • All important assumptions – with implications for the evaluation of the effects of dairy policy reform
The Danish quota value, % of producer price Value of Danish Quota, % of producer price Real interest rate, pct. Depreciation time, years
The Danish quota value, % of producer price Guyomard (2002) Jansson (2002) Jensen og Frandsen (2003) Value of Danish Quota, % of producer price Real interest rate, pct. Depreciation time, years
Different estimates • 1. Guyomard et al. (2002): • Use EC Farm Accountancy Data Network (FADN) to estimate marg. • costs but not entirely clear how. Quota rents: 15-49%. DK: 42% • 2. Jansson (2002): Depreciation time: 8 years, real interest rate: 6% • == > quota rent = 22% of milk price • 3. Jensen & Frandsen (2003): Depreciation: infinite, real interest: 4% • == > quota rent = 5% of milk price • Depreciation time reflects farmers’ expectations • High quota rents: No compensation for policy changes • Low quota rents: Compensation for future policy change
Quota rents, EU-15, 2001 % of producer price Source: Jensen & Frandsen (2003)
Illustrative simulations • To illustrate the impact of using different initial quota rents • when analysing EU dairy policy reform using CGE models • To stress the importance of recognising EU heterogeneity • Starting point is standard GTAP model and database (v 6.2) • Four different adjusted databases • “Small” (Jensen and Frandsen) and “large” (Guyomard) quota rents • EU-15 as a single region and EU-15 disaggregated • Simulation eliminates EU dairy export subsidies
Effects on third countries • Exports increase substantially • USA: 20-24% • Canada: 27-19% • Australia: 22-25% • New Zealand: 11-12% • Using large or small initial quota rents -> differences in results between 0.5 and 1 %-points
Preliminary findings • Initial quota rent estimates/assumptions influence results • Magnitude of change in production, exports and welfare • Both at EU aggregate level and for individual countries • Influence on 3rd country results is less significant • Ranking of initial quota rents is important for results • Important to discuss relative competitiveness among EU-15
Future work • National quota rent estimates (reliable marginal cost estimates and/or milk quota prices) • Relative competitiveness of EU15 (primary and processing) • => Survey initiated among agri-economic researchers in the EU • Disaggregate GTAP dairy sector into categories such as butter, cheese, SMP, WMP, and other dairy products • => Possibilities of collaboration with Trinity College, Dublin • Integration of full set of dairy policy instruments in models • Include rest of CAP in model, incl. EU budget and interregional transfers, accession of new member states, etc. • Baseline / update databases (dairy sector competitiveness depends on changes in factor markets, technology, policy, etc.)