Download
1 / 9
110 likes | 246 Views
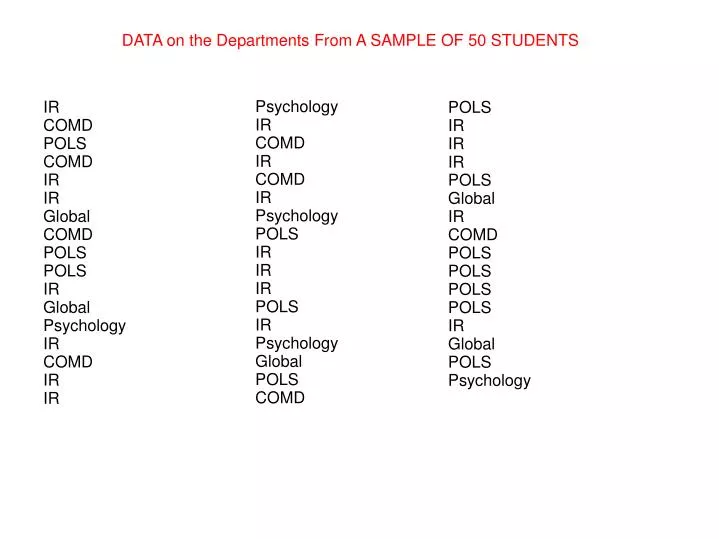
DATA on the Departments From A SAMPLE OF 50 STUDENTS. Psychology IR COMD IR COMD IR Psychology POLS IR IR IR POLS IR Psychology Global POLS COMD. IR COMD POLS COMD IR IR Global COMD POLS POLS IR Global Psychology IR COMD IR IR. POLS IR IR IR POLS Global IR

E N D
DATA on the Departments From A SAMPLE OF 50 STUDENTS Psychology IR COMD IR COMD IR Psychology POLS IR IR IR POLS IR Psychology Global POLSCOMD IR COMD POLS COMD IR IR Global COMD POLS POLS IR Global Psychology IR COMD IR IR POLS IR IR IR POLS Global IR COMD POLS POLS POLS POLS IR Global POLS Psychology
The points scored during each game by a basketball team last season were:60, 58, 65, 75, 50, 65, 60, 72, 64, 70, 58, 65, 56, 40, 68, and 55Construct a dotplot of these data.
The following Table represents a sample of 50 final exam scores
These data show the time in days required to complete year-end audit for a sample of 20 clients of a small accounting firm
Construct the stem and leaf display and also double stem display for the above data set.