Download
1 / 45
450 likes | 648 Views
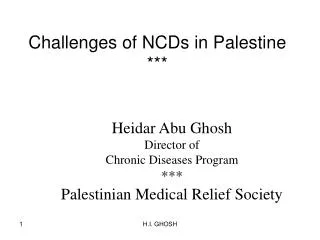
Demographic Trends and Challenges in case of Statehood in Palestine, 2012-2048 . Youssef Courbage Bir Zeit, January 2012 . Introduction. Two manners to analyze demographic trends and challenges in Palestine:

E N D
Demographic Trends and Challenges in case of Statehood in Palestine, 2012-2048 Youssef Courbage Bir Zeit, January 2012
Introduction • Two manners to analyze demographic trends and challenges in Palestine: • -As those of a « normal » country: size, growth, structure, projections, impact on education, on employment… • -As those of an occupied country. In this case we have to take into account that Palestinian and Israeli demography are deeply embedded. • In this space, that of « historical » Palestine, demography could not be detached of the Israeli project and to its Palestinian response. • The growth of the Jewish population and the reduction of the Palestinian one is a major strategic object of the Zionist project, before and after the Naqba of 1948.
Populationnism and pro-natalism • The Zionist project has been and still is populationist and pronatalist . • It was obviously based on immigration. • Less known but even more effective is the role of fertility, to have the largest number of Jewish children. • Not only for the ultra-orthodox and religious, but in all segments of the society. • By a mirror-effect, the Palestinians have been engaged into a “war of cradles” or a “battle of numbers” • Yet, by definition, benefiting from the sole asset of fertility (no possible immigration).
One or two states, depending on demography? • As far as Statehood is concerned, it is obvious that the establishment of a single state in Palestine, or of two states (in which form?) depends a great deal on the population dynamics of the two populations. • Fertility of the Palestinians for a long while had been an anomaly in the theory of demographic transition.
An atypical Jewish fertility… • Now it is the turn of the Jews in Israel to become the anomaly to this theory. • Very high GNP per capita (around 40 000 USD), no illiteracy, high intake in secondary and university education, high urbanization. • Yet, in spite of all these “inhibiting” factors to reproduction, Jewish fertility is increasing, which is a most uncommon situation. • With a rise from a high 2.6 in 1990 to 3.0 in 2010, Jewish fertility is likely to surpass Palestinian fertility, (1948 Palestinians, now at 3.5 and West Bank at 3.8). • A unique phenomenon (diaspora Jews at 1.5 only).
…confronted to the Palestinian fertility decline • Contrariwise, Palestinian fertility has followed the opposite pattern, after a rise during the first intifada, • and politically considered as an efficient weapon against Israeli occupation and colonization, it has fallen with the second intifada. • What has been the magnitude of this fall? Figures are rather puzzling depending on MOH estimates and PCBS : 3.4 according to the MOH, 4.5 according to the last PCBS published survey in 2006, 4.05 in the West Bank and 5.3 in Gaza in 2007 4.2 in 2010 : 3.8 in the West Bank, 4.9 in Gaza. • The most threatening demographic aspect for the statehood of Palestine in the future is the competition between Jewish demography and Palestinian one, namely in the conflict zones: the West Bank and East-Jerusalem.
The amazing increase of settlers population: low mortality… • Chart 1 shows the phenomenal growth of the numbers of settlers from 41 000 in 1977 to 560 000 in 2011, a multiplication by 14. • In the West Bank (including East Jerusalem), the annual rate of growth of the Jewish settlers is 4% per annum, for the Palestinian it is only 2.6%. • The higher increase of the Jewish settlers in the West bank is due to 4 factors: • Their lower mortality rate, higher life-expectancy than the Palestinians and less aged persons, above 65 years.
Immigration • Immigration: Indeed almost all the Jewish population in Palestine, founds its origin in immigration. • This is even more true for the Jewish settlers. Every year there are some 5 000 new comers thanks to immigration alone, either from the other side of the Green Line or directly from abroad. • Contrariwise, the Palestinians have been emigrating since 2000 as shown by the International Migration Survey taken in 2010 by PCBS. • But immigration does not tell the whole story. • More important is the extremely high fertility rate of the settlers, as such and compared to the Palestinians.
A “sub Saharan” fertility • The last Israel Central Bureau of Statistics yearbook of 2011 enables sound comparisons of fertility between Jews settlers and Palestinian “natives” in the West Bank. • Settler’s fertility has been rising all over the 4 decades following the 1967 occupation. In 2010, it had reached (without Jerusalem), 5.18 children per woman, thus increasing from an already high level of 5.06, in 2009, a 2.3% rise. • Settlers fertility is therefore much higher than Palestinian ones: 5.18 versus 3.8, thus more than one child per woman or 37% more.
population “momentum”, and the low age at marriage • Another reason for the high rate of growth of the settlers: • Is the population momentum , i.e. the fact that they have a high number of youngsters and the possibility to reach reproductive ages very quickly. (Chart 2), a very young age-sex structure comparable to what we find now in Sub Saharan Africa. • Also, their age at first marriage, both females and males is particularly low.
Chart 1: Jewish settlers in the West Bank (including East-Jerusalem), 1977-2011
Chart 2 : Age-sex structure of the Jewish population in the West Bank, 2010
Jerusalem, an even more complex issue • If we single out Jerusalem (which is what the Israeli statisticians do), it is noteworthy that the “war of cradles” here is even more intense. • The Palestinian population in East-Jerusalem had kept for long a high fertility, a sort of protection against political risks. • Yet, this situation did not last forever. Now, Palestinians have still a respectable 3.84 children on average in 2010, but lower than previous year and less by 11%, than the Jewish inhabitants of the Holy City: 4.26 (4.16, the previous year). • Fertility disequilibrium is even more pronounced, considering East-Jerusalem alone, fertility of the quarter of a million settlers (the precise figure is unknown), 5.40 exceeds the Palestinian one 3.84, by 40%.
The comparative situation of the Palestinians of 1948 • In the sixties of last century, with almost 9 children per woman (world record level), the Palestinians of 1948 (around 17% of the population of Israel, 4 June 1967 borders) • much exceeded the Jews, whose fertility was high but much lower: 3.4. • Now it is a completely different story. Jewish fertility is increasing, year after year. After a low of 2.6 it is now in the vicinities of 3 (2.97 for Jews by religion, 2.88 for “Jews and others (i.e; non Arab Christians, no religion. • Contrariwise, Palestinians of 1948, fertility was cut by 3 reaching a low of 3.3 now, hence few decimal point above Jewish fertility and
A reversal in fertility situation • Demographic trends, fuelled by fertility trends, the most effective component of population dynamics, shows (chart 4), proves the reversal of reproduction behavior, with the inversion in the West Bank and especially in East Jerusalem. • It shows also that in Israel, the convergence between Jewish and Palestinian of 1948 fertility is a matter of few years. • The remnants of high Palestinian fertility are found only in the Gaza strip only: 4.9 children per woman (but half what it used to be during first intifada).
Chart 4: Recent fertility differences among Palestinians and Jews, 2010
Population perspectives and Statehood • We will present now different sets of population perspectives from now on until 2048, pointing out the issues they raise in terms of statehood for the Palestinians. (Table 1). • Chart 5 presents the likely evolution of the total Palestinian population (West Bank, East Jerusalem, Gaza, Palestinians of 1948) compared to the Jewish population in historical Palestine. • As of 2020, the number of Palestinians will be equal to the number of Jews : 6.9 millions.
Table 1: Population perspectives in historical Palestine, 2011-2048
But, afterwards the Palestinians will increase more, namely thanks to population momentum, especially to the higher fertility of the Gaza strip, which lets recall has a fertility rate of 4.9, higher than Palestinian fertility of the West Bank and of East-Jerusalem. • On basis of this chart, we can infer that a one state on the whole of historical Palestine is inconceivable, for the Palestinians, naturally but also for the Israelis, whose occupation will create an inextricable demographic issue 9.2 million Jews (46%) dominating a majority of 11.8 millions Palestinians .
Chart 5 : The perspectives of the Palestinian and Jewish populations in historical Palestine
Without Gaza? • However, since 2005, Gaza had been detached by the Israelis from the area of direct occupation. Mainly, for demographic reasons: few thousand settlers facing 1.5 million Palestinians. • Hence, it makes sense to look at the demographic perspectives of historical Palestine excluding Gaza. (Chart 6). • In this case, while keeping almost the entire territory of historical Palestine, there will still be a comfortable Jewish majority, even in 2048 : 9.2 millions Jews and 6.7 millions Palestinians in the West bank, East-Jerusalem and the Palestinians of 1948.
A one state, under a demographic Jewish majority is therefore conceivable. Besides, the trend of the curves clearly show that after 2048, the numerical advantage will remain for the Jews. • Hence, a natural policy measure should be to everything possible to keep the Palestinian authority, and never single out Gaza. Failing to do this will pave the way to the creation of a One-state on almost all of historical Palestine.
The most serious issue: the demography of the settlers in the West Bank • Chart 7 presents 3 variants of popualtion growth of the settlers from 2011 unti 2048, based on varying assumptions of fertility and immigration. • Chart 8 gives the percentage of settilers in the total population of the West Bank.
Chart 8: Percentage of Jewish settlers in the West Bank (including East-Jerusalem)
Jerusalem • The growth of settlers in the West bank is mainly due to those living in East Jerusalem, which accounts for a little bit less than half the total number of settlers: 200 000 or more out of 560 000. • In East-Jerusalem, fertility differentials among Palestinians and settlers are now much higher than before and have recently increased in 2010. • Fertility will be the most important component to keep the Palestinian population in Jerusalem besides an “acceptable” threshold. • In the whole “reunified” city the proportion of Palestinians stands now at 37,6% in the city (296 000 Palestinians for a total of 788 000 inhabitants).
To keep Palestinians below 30% • The proclaimed official goal of the authorities, is to limit the proportion of Palestinians at 30%. • Few years ago in 2001, the Israeli demographer Sergio della Pergola forecasted that the proportion of Palestinians would continue to increase to 38-40% maybe, tosuch an extent that: • “A possible shift of the majority of Jerusalem’s population from the Jewish parts to the Arab and other parts”, would occur.
But this was before the tremendous increase in the building sector in the neighborhoods which would attract an even greater number of settlers because of immigration and especially the spectacular reversal of fertility trends. • Chart 9 presents the past growth of the two populations. • Since 1972, Jewish population has been multiplied by 2.13 while the Palestinian one was multiplied by 3.5. • This kind of differential growth would have undermined the israelization of the Holy City.
Policy measures • The proportion of Palestinians has been regularly increasing from 27%, reaching 30% (the threshold) in 1993 to 37% now. • Thus the demographic policy: • -Increase Jewish immigration to the East-Jerusalem settlements and to the Old city • -Encourage Palestinian emigration outside the city through administrative procedures • -Enlarge the perimeter of the city by unofficially integrating West bank settlements: Maale Adoumim, Goush Etzion.
How to counteract? • -And more importantly in the long term, to encourage high Jewish fertility: 5.7 children per woman now (against 3.8 for Palestinians, an enormous gap!). • Possible policy measures from the side of the PA. International actions to prevent buildings in the settlements. Locally, difficult to act for the reversal of Palestinians (and Jewish) fertility. More effective policy to prevent the expulsion of Palestinians from Jerusalem?
Chart 9:Past growth of the Palestinian and Jewish populations in Jerusalem, 1972-2010
Other issues: Demographic shifts, political shifts • Indeed, socio-economic and political developments impact on population dynamics. • Yet, demography might act also as an independent factor. • One important aspect in the prospects of Palestinian population, is the demographic differentials trends between the West Bank, East-Jerusalem and the Gaza strip. • From 2011 until 2048, the three population groups will increase but the trend will be lower in the West Bank and East-Jerusalem than in the Gaza strip. (Chart 10)
Chart 10: Palestinian population in the West Bank, Jerusalem and Gaza, 2011-2048
Much higher growth in Gaza • In the West Bank, fertility is lower and emigration has became significant. • Same, in East-Jerusalem, where the occupying authorities put pressure on the population to push them to emigrate. • In Gaza, there is strong population pressure, namely in terms of population density. • Yet, unless emigration from the Gaza strip becomes significant (but to where?), population increase will be phenomenal : even if fertility rate fell to the replacement level of 2.1 children per woman in 2048, the population of Gaza, 1.7 million now, will cross the threshold of 4 millions (3.8 millions if fertility fell to 1.7 children, a “European “level”.
Differential voting patterns in Gaza • At the last Palestinian elections, in 2006 there was a slight cleavage between the West Bank and the Gaza strip (Chart 11). • In Gaza other parties got a marginal proportion of the votes : 8% versus 23% in the West Bank and East-Jerusalem. • Hamas won almost the absolute majority in Gaza : 48.3% whereas in the West Bank, although the first in number of votes, it was at several points from the absolute majority:39.5%
Naturally, political attitudes, voting patterns are of course transient phenomena. We cannot assume that these patterns would remain for ever. • However, demographic shift of the population and of the electoral body from the West Bank to Gaza, whose share of 39% now will approach the absolute majority : 48% in 2048, (Chart 12) will probably impact on future Palestinian elections.
Chart 11: Voting patterns at the Palestinian elections in 2006
Chart 12: The proportion of the Palestinian population living in Gaza, 2011-2048
The case of the settlers • It is well known that the Israeli settlers in the West Bank and East-Jerusalem, do vote for the extremist parties, in a higher proportion than the population living beyond the Green Line. • Likud : 28% • Kadima 9% • Ysrael Beitenu 8% • And to religious parties: • Shas 11% • United Torah 14% • Ichid Leumi 20% • Labor 2%, Meretz, 0.5% Hadash and Balad : 0%.
Hence, the shift in population from the « Green Line » to the settlements, will translate mechanically into an increase of the voters for the right wing nationalists and religious parties. • The number of settlers is likely to grow to such an extent to reach 1.7 million and over 18% of the Jewish population in 2048. • The impact of this significant demographic shift on future elections results is obvious.
Chart 13: The population growth beyond the Green Line and in the settlements
Chart 14 : The proportion of the settlers population among the Jewish population
Conclusion • In 2011, recent demographic history presents one clear aspect : the inversion of demographic trends. • For Palestinians, demographic transition and fertility decrease has speeded. Against all odds. For the Israelis on the contrary, it is increasing, year by year without discontinuity. • This is a unique model in the world, which should push us to think of real modernization phenomena in this part of the world. • Concerning policy measures, Israeli fertility beyond the Green Line and in the settlements has been encouraged by the demographic policy of the State to increase Jewish fertility. Billion of dollars have been spent for this purpose. Lessons should be taken from this “successful experience”.