Download
1 / 3
30 likes | 169 Views
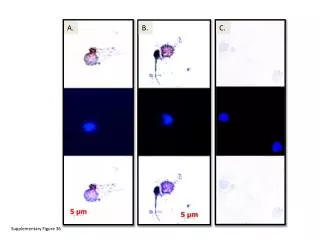
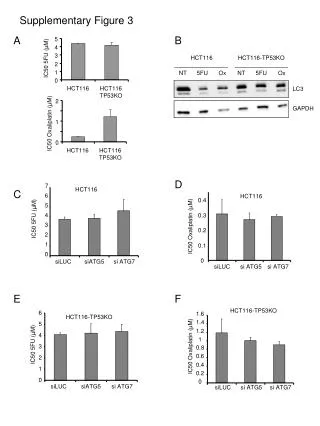
Supplementary FIGURE 3. LSC segmentation scheme Tumor FNAs. A. Representative COLO205 Tumor Xenograft FNA Vehicle Control. Scan Area View (DAPI). Field Image V iew (DAPI). P rimary Contour ( DAPI, blue) Anti-p-Histone H3 + ( red, arrow). DNA content (DAPI). DNA content (DAPI)

E N D
Supplementary FIGURE 3 LSC segmentation scheme Tumor FNAs
A Representative COLO205 Tumor Xenograft FNA Vehicle Control Scan Area View (DAPI) Field Image View (DAPI) Primary Contour (DAPI, blue) Anti-p-Histone H3 + (red, arrow) DNA content (DAPI) DNA content (DAPI) Integral Vs. Maxpixel DNA content (DAPI) Vs. Anti-p-Histone H3 R2 R1 R1 G2M
B Representative Primary Breast Tumor Mock FNA Primary Contour (DAPI) Anti-EPCAM Anti-p-Histone H3 (red, arrow) Scan Area View (DAPI) Field Image View (DAPI) DNA content Profile (DAPI) DNA content (DAPI) Vs. Anti-p-Histone H3 DNA content (DAPI) Vs. Anti-EPCAM R1 R2 R1 G2M