Download
1 / 30
300 likes | 370 Views
Investigation 2 Types of Data. Michelle Ballentine Kendria Sutherlin Verra Williams. Quote. It is a mathematical fact that 50% of all doctors graduate in the bottom of their class. ~Unknown. POD. How many times can you subtract 7 from 83? What is left afterwards?.

E N D
Investigation 2Types of Data Michelle Ballentine Kendria Sutherlin Verra Williams
Quote It is a mathematical fact that 50% of all doctors graduate in the bottom of their class. ~Unknown
POD How many times can you subtract 7 from 83? What is left afterwards?
You can subtract it as many times as you want, and it leaves 76 every time. 83-7 =76 83-7 =76 83-7 =76 83-7 =76 83-7 =76 83-7 =76
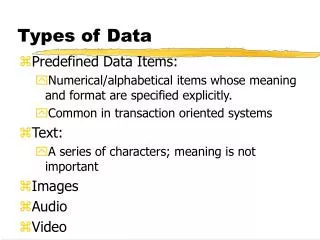
OBJECTIVE • To note the kind of data being collected; that is categorical or numerical • To use bar graphs to display categorical and numerical data • To understand how measures of center (median, mode) and spread (range) relate to numerical and categorical data
I have Who has?
Problem 2.1 • From the graphs definitions you formed by doing IMOW, complete the following: • Write two questions that have categorical data as answers. • Write two questions that have numerical data as answers.
Journal Writing • Problem 2.1 Follow-UP • Is it possible to find the mode of a set of categorical data? Explain your answer. • THINK PAIR SHARE
HOMEWORK ACE problems 1-8 page 26
What type of graph is it? CIRCLE
Classroom Activity • Using animal crackers create the following: • Bar graph or line plot • Circle graph with the following: fraction, decimal & percent Make sure you graph has the following elements: Title, legend, labeled y-axis and x-axis Materials: Poster board, glue, animal crackers
Problem 2.2 • Decide whether each question below can be answered by using data from the graphs the students created. If a question can be answered, explain why not and tell what additional information you would need to answer the question.
Which graph show categorical data, and which graph shows numerical data? • What is the total number of pets the students have? • What is the greatest number of pets that any student in the class has? • How many students are in the class? • How many students chose cats as their favorite kind of pet?
How many cats do students have as pets? • What is the mode for the favorite kind of pet? • What is the median number of pets students have? • What is the range of the numbers of pets students have? • Tomas is a student in this class. How many pets does he have? • Do the girls have more pets than the boys?
Journal Writing • Follow-Up 2.2 • Do you think the students surveyed live in a city, the suburbs, or the country? Explain your answer.
HOMEWORK ACE Problems #’s: 9-14 pages 26-28
JOURNAL REFLECTIONS Page 29 Problems 1-3
WORD WALL • Mode • Range • Average (mean) • Measures of center • Median • Bar graph • Line plot • Categorical • numerical
ACOS • Standard 1 • Standard 2 • Standard 10