Download
1 / 41
410 likes | 508 Views
The Forecast Process. ATMO 4300 Spring 2010. Scales of Motion. Global (Planetary) Scale Synoptic Scale Mesoscale. Figure from www.atmos.washington.edu/2003Q3/101/notes. ITCZ. Average Pressure in January. Average Pressure in July. The Polar Front.

E N D
The Forecast Process ATMO 4300 Spring 2010
Scales of Motion • Global (Planetary) Scale • Synoptic Scale • Mesoscale
Seasonal Position of Jet StreamFigure from www.earth.rochester.edu/fehnlab/ees215/fig17_8.jpg
Scales of Motion • Global (Planetary) Scale • Synoptic Scale • Mesoscale
Scales of Motion • Global (Planetary) Scale • Synoptic Scale • Mesoscale
Climatology • Using long-term averages to forecast a particular weather element • Example: • What’s the problem with using Climatology?
Persistence • Current Weather = Future Weather • Accuracy depends on: 1. Time scale 2. Progressive vs. stagnant weather pattern • Example:
Trend • Extrapolating current weather out in time based on steady-state conditions • Best for approx 0-6 hours (Nowcasting) • Example: • What’s the problem with this method?
Analogue • Also called “Pattern Recognition” • Today’s weather similar to a past event • Forecast based on what happened with the past event • Example: • What’s the problem with this method?
Analogue - Example • Go to the following web site: • http://tropical.atmos.colostate.edu • Click on Forecasts • Click first “new” link • Scroll down to No. 5
Variations on Analogue Method • Teleconnections – Relationship between weather in one part of the globe to events in another part • Used in long-range forecasting • Example: El Nino – connection between tropics and North America
El Nino • What is it? • An event associated with significant warming of sea surface temperatures in the eastern tropical Pacific Ocean.
Normal Sea Surface Temps • Ocean temperatures are normally warmer in the west and colder in the east. • Figures from www.cpc.ncep.noaa.gov
Misconceptions about El Nino • El Nino or La Nina does not directly cause any one particular weather event.
Variations on Analogue Method • Decision Trees / Checklists • Using common parameters associated with many past events • “Rules of thumb” • Example:
Example of Decision Trees • Class Home Page • Click link to All NWS Offices • Click Midland on the map • Click Office Information • Click Local Research • Click on 5th article
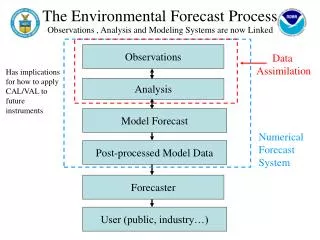
Numerical Weather Prediction • Using computer models of the atmosphere to predict weather variables • Model Output Statistics (MOS) • Ensembles
The Forecast Process • With all the data and the different forecasting methods, how do you decide what to forecast? • Rain or sunny • Snow amount • Graphic from www.lib.umassd.edu/graphics/judge.gif
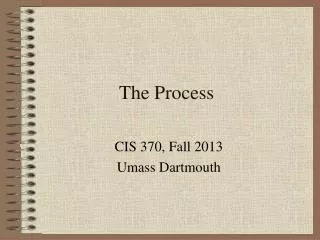
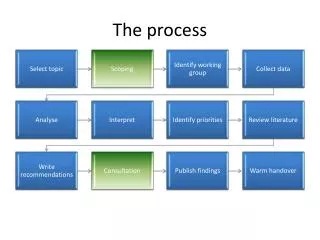
A Systematic Approach • Start with the Big Picture - Look at the hemispheric (or partial hemispheric) upper wind flow pattern - Look at a large scale water vapor satellite animation (current & recent history)
A Systematic Approach • Review Synoptic Scale - Surface map – cyclones/anticyclones, air mass boundaries - Upper air maps – troughs/ridges, PVA/NVA, temp advection, meridional vs zonal flow - Radar/satellite – precip/clouds in and near forecast area
A Systematic Approach • Associate current weather with causes. Example: Evaluate moisture and lift for precip.
A Systematic Approach • What is the time period of your forecast? Example: 0 – 6 hours (Nowcast) Radar, satellite, profilers, detailed surface analysis Example: Days 1 to 7 Numerical Weather Prediction models
A Systematic Approach • Choose a forecast methodology(s) • What weather elements am I forecasting and what will affect those elements? • When forecasting different weather elements, usually best to forecast temps last.
Summary • What happened and why? • What is happening and why? • What is going to happen and why? • Adapted from Lance Bosart, SUNY, Albany