Download
1 / 40
470 likes | 565 Views
Map projection. Dr. Salve P. N. M.A.,SET, Ph.D . Maharaja Jivajiro Shinde Mahavidyalya Shrigonda Dist : Ahmednagar. Map projection.

E N D
Map projection • Dr. Salve P. N. • M.A.,SET, Ph.D. • Maharaja JivajiroShindeMahavidyalyaShrigonda • Dist : Ahmednagar
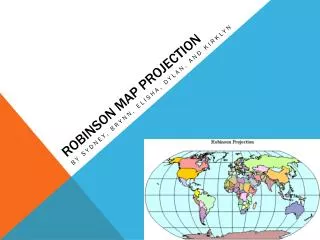
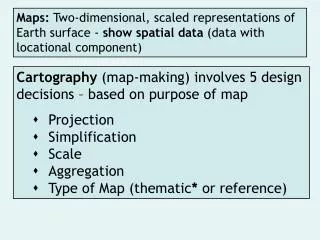
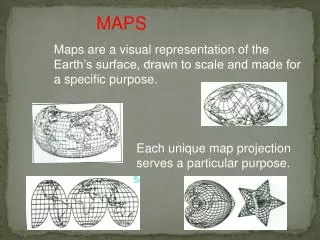
Map projection • A map projectionis a systematic transformation of the latitudes and longitudes of locations from the surface of a sphere or an ellipsoid into locations on a plane. • Mapscannot be created without map projections. • All map projections necessarily distort the surface in some fashion. • Depending on the purpose of the map, some distortions are acceptable and others are not; therefore, different map projections exist in order to preserve some properties of the sphere-like body at the expense of other properties. There is no limit to the number of possible map projections. • More generally, the surfaces of planetary bodies can be mapped even if they are too irregular to be modeled well with a sphere or ellipsoid; see below. Even more generally, projections are a subject of several pure mathematical fields, including differential geometry, projective geometry, and manifolds. However, "map projection" refers specifically to a cartographic projection.
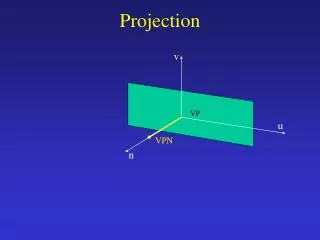
An azimuth(from the pl. form of the Arabic noun as-samt, meaning "the direction") is an angular measurement in a spherical coordinate system. The vector from an observer (origin) to a point of interest is projectedperpendicularly onto a reference plane; the angle between the projected vector and a reference vector on the reference plane is called the azimuth. • An example is the position of a star in the sky. The star is the point of interest, the reference plane is the horizonor the surface of the sea, and the reference vector points north. The azimuth is the angle between the north vector and the perpendicular projection of the star down onto the horizon.[
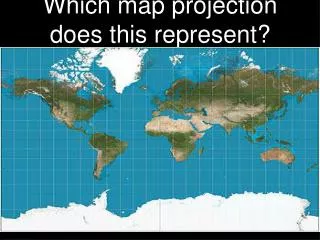
Mercator projection • The Mercator projection is a cylindrical map projection presented by the Flemish geographer and cartographer Gerardus Mercator in 1569. • It became the standard map projection for nautical purposes because of its ability to represent lines of constant course, known as rhumb lines or loxodromes, as straight segments that conserve the angles with the meridians. • Although the linear scale is equal in all directions around any point, thus preserving the angles and the shapes of small objects (which makes the projection conformal), the Mercator projection distorts the size of objects as the latitude increases from the Equator to the poles, where the scale becomes infinite. So, for example, landmasses such as Greenland and Antarctica appear much larger than they actually are relative to land masses near the equator, such as Central Africa.
Mercator's 1569 edition was a large planisphere measuring 202 by 124 cm, printed in eighteen separate sheets. • As in all cylindrical projections, parallels and meridians are straight and perpendicular to each other. In accomplishing this, the unavoidable east-west stretching of the map, which increases as distance away from the equator increases, is accompanied in the Mercator projection by a corresponding north-south stretching, so that at every point location the east-west scale is the same as the north-south scale, making the projection conformal. • Being a conformal projection, angles are preserved around all locations. • Because the linear scale of a Mercator map increases with latitude, it distorts the size of geographical objects far from the equator and conveys a distorted perception of the overall geometry of the planet. • At latitudes greater than 70° north or south the Mercator projection is practically unusable, since the linear scale becomes infinitely high at the poles. A Mercator map can therefore never fully show the polar areas (as long as the projection is based on a cylinder centered on the Earth’s rotation axis; see the Transverse Mercator projection for another application).
All lines of constant bearing (rhumbs or loxodromes—those making constant angles with the meridians) are represented by straight segments on a Mercator map. The two properties, conformality and straight rhumb lines, make this projection uniquely suited to marine navigation: courses and bearings are measured using wind roses or protractors, and the corresponding directions are easily transferred from point to point, on the map, with the help of a parallel ruler or a pair of navigational protractor triangles. • The name and explanations given by Mercator to his world map (Nova et Aucta Orbis Terrae Descriptio ad Usum Navigantium Emendata: "new and augmented description of Earth corrected for the use of sailors") show that it was expressly conceived for the use of marine navigation. Although the method of construction is not explained by the author, Mercator probably used a graphical method, transferring some rhumb lines previously plotted on a globe to a square graticule (grid formed by lines of latitude and longitude), and then adjusting the spacing between parallels so that those lines became straight, making the same angle with the meridians as in the globe. • The development of the Mercator projection represented a major breakthrough in the nautical cartography of the 16th century. However, it was much ahead of its time, since the old navigational and surveying techniques were not compatible with its use in navigation. Two main problems prevented its immediate application: the impossibility of determining the longitude at sea with adequate accuracy and the fact that magnetic directions, instead of geographical directions, were used in navigation. Only in the middle of the 18th century, after the marine chronometer was invented and the spatial distribution of magnetic declination was known, could the Mercator projection be fully adopted by navigators.
Several authors are associated with the development of Mercator projection: • German Erhard Etzlaub (c. 1460–1532), who had engraved miniature "compass maps" (about 10×8 cm) of Europe and parts of Africa, latitudes 67°–0°, to allow adjustment of his portable pocket-size sundials, was for decades declared to have designed "a projection identical to Mercator's". • Portuguese mathematician and cosmographer Pedro Nunes (1502–1578), who first described the loxodromic and its use in marine navigation, and suggested the construction of a nautical atlas composed of several large-scale sheets in the cylindrical equidistant projection as a way to minimize distortion of directions. If these sheets were brought to the same scale and assembled an approximation of the Mercator projection would be obtained (1537). • English mathematician Edward Wright (c. 1558–1615), who published accurate tables for its construction (1599, 1610). • English mathematicians Thomas Harriot (1560–1621) and Henry Bond (c.1600–1678) who, independently (c.1600 and 1645), associated the Mercator projection with its modern logarithmic formula, later deduced by calculus.
Uses • As on all map projections, shapes or sizes are distortions of the true layout of the Earth's surface. The Mercator projection exaggerates areas far from the equator. For example: • Greenland appears larger than Africa, when in reality Africa's area is 14 times greater and Greenland's is comparable to Algeria's alone. Africa also appears to be roughly the same size as Europe, when in reality Africa is nearly 3 times larger. • Alaska takes as much area on the map as Brazil, when Brazil's area is nearly five times that of Alaska. • Finland appears with a greater north-south extent than India, although India's is greater. • Antarctica appears as the biggest continent (and would be infinitely large on a complete map), although it is actually the fifth in area. • The Mercator projection is still used commonly for navigation. On the other hand, because of great land area distortions, it is not well suited for general world maps. Therefore, Mercator himself used the equal-area sinusoidal projection to show relative areas. However, despite such distortions, Mercator projection was, especially in the late 19th and early 20th centuries, perhaps the most common projection used in world maps, but in this use, it has much been criticized.Because of its very common usage, it has been supposed to have greatly influenced on people's view of the world, and because it shows countries near the Equator as far too small when compared to those of Europe and North America, it has been supposed to cause people to consider those countries as less important.As a result of these criticisms, most modern atlases no longer use the Mercator projection for world maps or for areas distant from the equator, preferring other cylindrical projections, or forms of equal-area projection. The Mercator projection is still commonly used for areas near the equator, however, where distortion is minimal. • Arno Peters stirred controversy when he proposed what is now usually called the Gall–Peters projection as the alternative to the Mercator. The projection he promoted is a specific parameterization of the cylindrical equal-area projection. In response, a 1989 resolution by seven North American geographical groups deprecated the use of cylindrical projections for general purpose world maps, which would include both the Mercator and the Gall–Peters.