Download
1 / 31
380 likes | 710 Views
An Automated Malaria Parasite Detection System Using Artificial Intelligence Technique. VIJAYA BASKAR AL KASI WEK060130. SUPERVISOR: Dr. S. RAVIRAJA. Presentation Outline. Introduction Research Motivation Research Objectives Project Limitation Research Contributions Literature Survey

E N D
An Automated Malaria Parasite Detection System Using Artificial Intelligence Technique VIJAYA BASKAR A\L KASI WEK060130 SUPERVISOR: Dr. S. RAVIRAJA Producing Leaders since 1905
Presentation Outline • Introduction • Research Motivation • Research Objectives • Project Limitation • Research Contributions • Literature Survey • Research Methodology • Work Schedule • Data Collection • Methodology • Overall System • Conclusion • References Producing Leaders since 1905
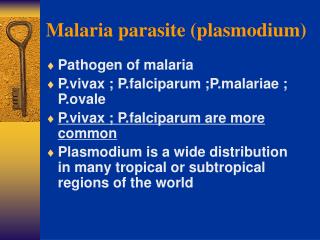
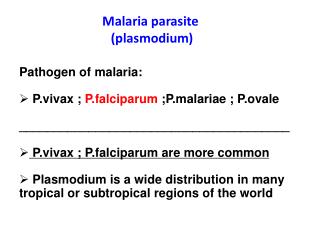
Introduction..1 • Malaria are protozoan parasites- subclass coccidian. • This disease transmitted by the female Anopheles mosquito, caused by parasitic protozoa of the genus Plasmodium spp. • It infect human usually in the cells of the liver and then in the red cells, by inserting into the hosts to populate. Producing Leaders since 1905
Introduction ..2 Figure: Malaria transmission Cycle Producing Leaders since 1905
Introduction ..3 • This malaria parasitic infection cases usually appears in developing countries. • Estimated 500 million cases or more each year between 1 and 3 million deaths per year, where Africa loses US 12 billion every year due to malaria (1% of GDP). • Pregnant woman, elderly people and young children are the most vulnerable victims. Figure: Malaria Infected patient Producing Leaders since 1905
Introduction ..4 Figure: Malaria-endemic Countries, 2006 Producing Leaders since 1905
Introduction ..5 • In blood effected by malaria parasite - look for, red both mature and young reticulocytes and white. • For parasites, in different stages of life, immature and mature trophozoites, schizonts and gametocytes. • Basically, three different kind of cells, which are red cell, white cell and platelets or artifacts are focused. Figure: Malaria Infected Blood Slide Producing Leaders since 1905
Introduction ..6 • The command diagnosis method for malaria infection is carried out by searching for parasites in blood sample slides through a microscope manually. Figure: Manual lab diagnose of malaria infected blood cells Producing Leaders since 1905
Introduction ..7 • Develop a novel technique to detect the malaria parasite infected blood cells using a digital image processing concepts and an AI technique which is artificial neural network on stained malarial blood from a microscope in order to detect malaria parasite infected blood cells. • Since manual analyses of slides are tiring and time-consuming - faster and accurate analysis of the microscopic images obtained from the blood sample slides. Producing Leaders since 1905
Research Objectives • To develop a computer-assisted detection system to detect malaria parasite infected blood cells. • Develop an automated image processing technique for digital malaria parasite infected blood cell images. • Along with an artificial intelligence (AI) based classification scheme using supervised machine learning which is artificial neural network(ANN) for classification of malaria infected blood cells base on four types of species: • Falciparum • Vivax • Malariae • Ovale Producing Leaders since 1905
Project Limitation • System designed operate with 2D images • The system input images should be fed in BMP/Tiff format • 8 bit per pixel and 65 X 65 h/w and above • System only diagnose/ analyze the parasitic infected disease case of Malaria. Producing Leaders since 1905
Research Contribution • The system designed to assist doctors, medical practitioners or lab technicians to analyze and identify malaria protozoan infected blood cells in less time, the end-user can diagnose the patient’s blood samples in more efficient way and is cost-effective in terms of time and manpower. • Chances of survival of patients significantly grow if malaria infected blood cells are detected at early stages. • By using few algorithms and libraries, the new system is proposed which is robust, real time and automated detection of malaria parasites efficiently. Producing Leaders since 1905
Literature Survey • Various solutions to solve the problem above are found, with the presents of digital image processing and digital signal processing. Now the time taken to inspect 500-2000 cells in a blood slide is done very fast and with very less labour intensives: • Analysis of Detecting the Malaria Parasite Infected Blood Images Using Statistical Based Approach: (S Raviraja et al 2006) • Analysis of Infected Blood Cell Images using Morphological Operators: (Cecilia Di Ruberto et al 2006). • Malaria parasite detection in peripheral blood images.(F. BorayTek et al 2006). • Neural Network Architecture for Automated Recognition of Intracellular Malaria Parasites in Stained Blood Films.(SobathPradeepaPremaratne et al2007). Producing Leaders since 1905
Literature Survey • 5. Automated Image Processing Method for the Diagnosis and Classification of Malaria on Thin Blood Smears .(Nicholas E. Ross et al 2006). • Malaria Count: An image analysis-based program for the accurate determination of parasitemia.(Selena W.S. Sio et al 2007) • Statistical Approach in Analysis of Malarial Parasite Infected Blood Image Detection and identification of its stability (S Raviraja et al 2006). • Mathematical Criteria for Stability of Online Database Improving Quality of Service(S Raviraja et al 2006). • Statistical Approach in Analysis of Malarial Parasite Infected Blood Image Detection and identification of its stabilityAJMMS 2007(S Raviraja et al 2007). • A Novel Technique for Malaria Diagnosis using invariant moments and by image compression(S Raviraja et al 2008) Producing Leaders since 1905
Research Methodology Convert the sample into BMP/TIF format Represent the samples as two Dimensions Matrix Check Sample Header Take the Sample Perform image processing such As transformation, segmentation Perform ANN techniques on the processed image Compare the output image Print the matching results Figure: Flowchart of the proposed computer-assisted detection system Producing Leaders since 1905
Work Schedule Producing Leaders since 1905
Data Collection • Unable to acquire real malaria blood cell slide data from Malaysian Hospitals, such as: Universiti Malaya Medical Centre (UMMC) and Hospital Kuala Lumpur. • Patient data considered confidential, hence, not easily to acquirable from hospitals for purpose of research study. • Data collected from internet databases most widely used by researchers. Producing Leaders since 1905
Methodology…1 • Software developed using C++ and an opensorce image processing library OpenCv. • Images are being compressed to 380x380 pixels for faster processing. • Image Grayscalling • This type of image is composed exclusively of shades of gray, varying from black at the weakest intensity to white at the strongest intensity which is ranging from 0-255. • Grayscale images are also known as monochromatic, denoting the absence of any chromatic variation. Producing Leaders since 1905
Methodology…2 • Noise Removal from Images • Noise removed from grayscale [0, 255] images, (represented in a matrix) by using two-dimensional (2D) Gaussian filtering in a 3-by-3 neighborhood. • When applied in two dimensions, this formula produces a surface whose contours are concentric circle with a Gaussian distribution from the center point. • Values from this distribution are used to build a convolution matrix which is applied to the original image. • Each pixel's new value is set to a weighted average of that pixel's neighborhood. • The original pixel's value receives the heaviest weight (having the highest Gaussian value) and neighboring pixels receive smaller weights as their distance to the original pixel increases. • This results in a blur that preserves boundaries and edges better than other, more uniform blurring filters. Producing Leaders since 1905
Methodology…3 (a) (b) (c) • Figure : Removal of noise using 2D Gaussian filtering • Original image with noise and distortion, (b) Grayscaled image, • c) Image after Gaussian Noise removal Producing Leaders since 1905
Methodology…4 • Image Edge Detection & Edge Linking • There are various types of edge detection algorithms and we choose canny edge detection algorithm for our project. • An edge in an image may point in a variety of directions, so the Canny algorithm uses four filters to detect horizontal, vertical and diagonal edges in the blurred image. • The Canny algorithm contains a number of adjustable parameters, which can affect the effectiveness of the algorithm and the computation time. Following are the parameters in concern: • 1) The size of the Gaussian filter • 2) Thresholds • The edge detected contours need to be linked together at their terminal points to form closed boundaries around the RBCs. Two parameters are being used, which are parameter1 and parameter2. The smaller both parameters, the better edge linking is. The parameter can range from [0 255]. Producing Leaders since 1905
Methodology…5 • Clump Splitting • The clumping together of RBCs effects the accuracy of the parasitemia. Therefore, a clump splitting method is implemented to separate clumps of two RBCs into constituent cell of interest • The clump splitting is done by implementing following methods: • 1) Polygon approximation • 2) Convex hull segmenting • 3) Convex defects Producing Leaders since 1905
Methodology…6 Figure: Edge detection, edge linking and Clump Splitting (a) Edge detection using Canny filtering and edge linking (b) Clump splitting of two clumping RBCs. (a) (b) Producing Leaders since 1905
Methodology…7 • Feature Extraction • Involves ellipse process and following by identifying the parasitic infected blood cells using size, length and width. • Ellipse processing is used to match different segments of the contour into separate single cells. Figure: Ellipse Image Producing Leaders since 1905
Methodology…8 • Artificial Neural Network Training (ANN) Figure: Multilayer Perceptron (ANN) Producing Leaders since 1905
Overall System Figure: Overall system Producing Leaders since 1905
Conclusion • The proposed system successfully performs all the preprocessing steps also training and classification based on feature extraction. • Due to the less availability of image samples, the system is tested and shows 80% (i.e., 4 out of 5) accurecy compared to lab investigation Producing Leaders since 1905
Further Work • Image analysis for higher resolution, 2D Color histogram and lifecycle detection. • Redesigning the system for enhancement by using different AI Techniques. • The numbers of stored samples in the database is small because of unavailability of all kind of samples due to the time scale of the project thru a collaboration from the hospital we are intended to solve this problem and enhance training and testing phase of this project. • The problem of undetermined parasite phases, to enhance the system. • The problem of undetermined parasite phases. We consider the result we reached is a good try to build a complete computer diagnosis system to malaria disease, it may be extended using the same technique to diagnosis different type of diseases. Producing Leaders since 1905
References [1]García-Arteaga, J.D.(2006). Conventional Microscopy for Malaria Diagnosis, Workshop on Microscopy and Medical Image Processing 14-15 May 2006, Linz, Austria [2]Tek, F. Boray and Dempster, Andrew G. and Kale, Izzet (2006) Malaria parasite detection in peripheral blood images In: Chantler, M.J. and Trucco, E. and Fisher, R.B., (eds.) British Machine Vision onference 2006 (BMVC 2006). BMVA, Edinburgh, UK, pp. 347-356 [3]S Raviraja, Gaurav Bajpai, and Sudhir Kumar Sharma. (2006). Analysis of Detecting the Malaria Parasite Infected Blood Images Using Statistical Based Approach [4]Ruberto, C.D., Dempster, A., Shahid Khan, and Jarra, B. (2002). Analysis of Infected Blood Cell Images using Morphological Operators. Image and Vision Computing , 20,133-146 [5]Sobath Pradeepa Premaratne , Nadira Dharshani Karunaweera , Shyam Fernando , WSupun R Perera and R P Asanga S RajapakshaA. ()Neural Network Architecture for Automated Recognition of Intracellular Malaria Parasites in Stained Blood Films [6]K. Mitiku, G. Mengistu, and B. Gelaw. The reliability of blood film examination for malaria at the peripheral health unit. Ethiop.J.Health Dev, 17(3):197–204, 2003. [7]J.D. Smyth (1994) “Introduction to animal parasitology”, Cambridge University Press, Cambridge. [8]S. Raviraja, Gaurav Bajpai, Sudhir Kumar Sharma, “Analysis of detecting the malarial parasite infected blood images using statistical based approach” BioMed 2006, Kuala Lumpur International Conference on BioMedical Engineering Malaysia. IFMBE Proceedings The International Federation for Medical and Biological Engineering, ISSN 1680-0737, Vol 15 pp 534-537, 2006. Producing Leaders since 1905
References • [9]S. Raviraja,GauravBajpai “Statistical Approach in Analysis of Malarial Parasite Infected Blood Image Detection and identification of its stability” SCRA 2006-FIM XIII-Thirteenth International Conference of the Forum for Interdisciplinary Mathematics on Interdisciplinary Mathematical and Statistical Techniques, New University of Lisbon-Tomar Polytechnic Institute, Lisbon, Portugal sep 1-4, 2006. • [10]GauravBajpai, S. Raviraja, Siaf E.O. Saeed “Mathematical Criteria for Stability of Online Database Improving Quality of Service” SCRA 2006-FIM XIII-Thirteenth International Conference of the Forum for Interdisciplinary Mathematics on Interdisciplinary Mathematical and Statistical Techniques, New University of Lisbon-Tomar Polytechnic Institute, Lisbon, Portugal sep 1-4, 2006. • [11]S. Raviraja, GauravBajpai “Statistical Approach in Analysis of Malarial ParasiteInfected Blood Image Detection and identification of its stability” American Journal of Mathematical and Management Sciences, AJMMS 2007. • [12]S. Raviraja, SaifSaeedOsman, Kardman "A Novel Technique for Malaria Diagnosis using invariant moments and by image compression", 4th Kuala Lumpur International Conference on Biomedical Engineering (Biomed 2008) Malaysia. IFMBE Proceedings, the International Federation for Medical and Biological Engineering, ISSN 1680-0737, pp 730-733. • [13]Selena W.S. Sio , Weiling Sun, Saravana Kumar, Wong Zeng Bin, Soon Shan Tan , SimHengOng, Haruhisa Kikuchi, YoshiteruOshima, Kevin S.W. Tan, (2007) 11 –18,“MalariaCount: An image analysis-based program for the accurate determination of parasitemia”, Received from www.ScienceDirect.com on 11 July 2006. • [14]Nicholas E. Ross, Charles J. Pritchard, David M. Rubin, Adriano G. Duse, (2006), Automated image processing method for the diagnosis and classification of malaria on thin blood smears, International Federation for Medical and Biological Engineering 2006. Producing Leaders since 1905
Q & A? • THANK YOU! Producing Leaders since 1905