Download
1 / 1
10 likes | 128 Views
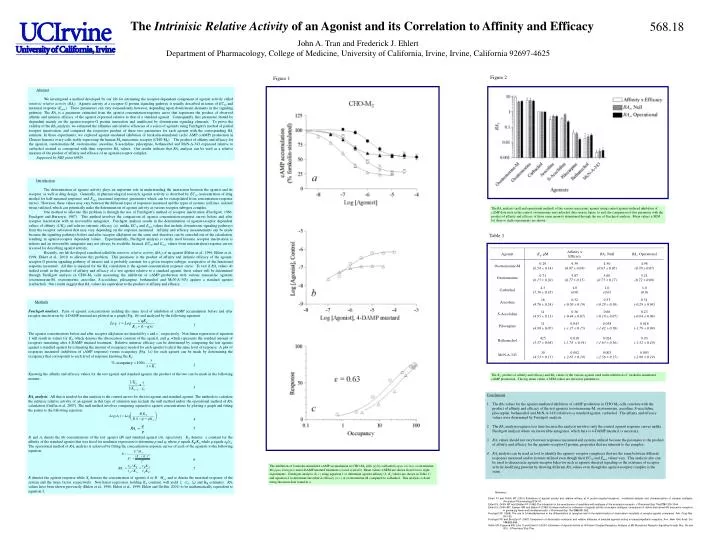
The Intrinisic Relative Activity of an Agonist and its Correlation to Affinity and Efficacy. 568.18. John A. Tran and Frederick J. Ehlert Department of Pharmacology, College of Medicine, University of California, Irvine, Irvine, California 92697-4625. Figure 2. Figure 1. Abstract

E N D
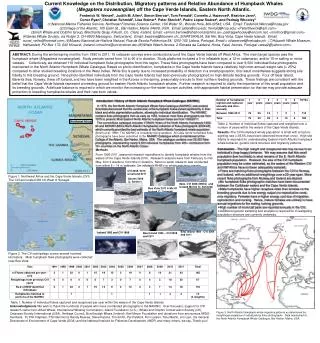
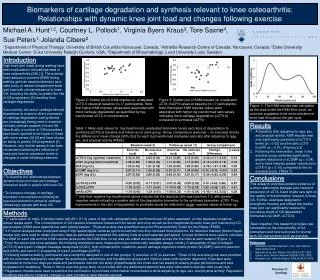
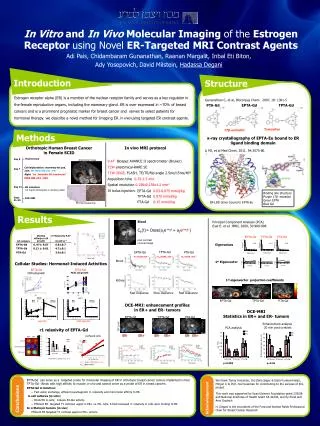
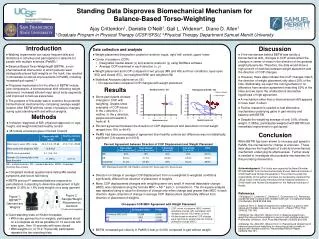
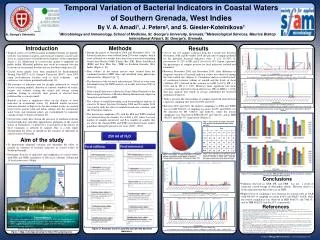
The Intrinisic Relative Activity of an Agonist and its Correlation to Affinity and Efficacy 568.18 John A. Tran and Frederick J. Ehlert Department of Pharmacology, College of Medicine, University of California, Irvine, Irvine, California 92697-4625 Figure 2 Figure 1 Abstract We investigated a method developed by our lab for estimating the receptor-dependent component of agonist activity called intrinsic relative activity (RAi). Agonist activity at a receptor-G protein signaling pathway is usually described in terms of EC50 and maximal response (Emax). These parameters can vary tremendously however, depending upon downstream elements in the signaling pathway. The RAi is a parameter estimated from the agonist concentration-response curve that represents the product of observed affinity and intrinsic efficacy of the agonist expressed relative to that of a standard agonist. Consequently, this parameter should be dependent mainly on the agonist-receptor-G protein interaction and unaffected by downstream signaling elements. To prove the validity of the RAi analysis, we estimated the affinities and relative efficacies of a series of agonists using Furchgott’s method of partial receptor inactivation, and compared the respective product of these two parameters for each agonist with the corresponding RAi estimate. In these experiments, we explored agonist–mediated inhibition of forskolin-stimulated cyclic AMP (cAMP) production in Chinese hamster ovary cells stably expressing the human M2 muscarinic receptor (CHO-M2). The product of affinity and efficacy for the agonists, oxotremorine-M, oxotremorine, arecoline, S-aceclidine, pilocarpine, bethanechol and McN-A-343 expressed relative to carbachol seemed to correspond with their respective RAi values. Our results indicate that RAi analysis can be used as a relative measure of the product of affinity and efficacy of an agonist-receptor complex. Supported by NIH grant 69829 Introduction The determination of agonist activity plays an important role in understanding the interaction between the agonist and its receptor, as well as drug design. Generally, in pharmacological research, agonist activity is described by EC50 (concentration of drug needed for half-maximal response) and Emax (maximal response) parameters which can be extrapolated from concentration-response curves. However, these values may vary between the different types of responses measured and the types of systems (cell line, isolated tissue) utilized, which can potentially make the determination of agonist activity at various receptor subtypes complex. One method to alleviate this problem is through the use of Furchgott’s method of receptor inactivation (Furchgott, 1966; Furchgott and Bursztyn, 1967). This method involves the comparison of agonist concentration-response curves before and after receptor inactivation with an irreversible antagonist. Furchgott analysis results in the determination of agonist-receptor dependent values of affinity (1/Kd) and relative intrinsic efficacy (e), unlike EC50 and Emaxvalues that include downstream signaling pathways from the receptor activation that may vary depending on the response measured. Affinity and efficacy measurements can be made because the signaling pathways before and after receptor alkylation are the same and, therefore can be canceled out of the calculation, resulting in agonist-receptor dependent values. Experimentally, Furchgott analysis is rarely used because receptor inactivation is tedious and an irreversible antagonist may not always be available. Instead, EC50 and Emax values from concentration-response curves are used for describing agonist activity. Recently, our lab developed a method called the intrinsic relative activity (RAi) of an agonist (Ehlert et al., 1996; Ehlert et al., 1999; Ehlert et al., 2001) to alleviate this problem. This parameter is the product of affinity and intrinsic efficacy of the agonist-receptor-G protein signaling pathway of interest and is probably constant for a given receptor subtype, irrespective of the functional response measured. All that is required for the RAi calculation is the agonist-concentration response curve. To test if RAi values do indeed result in the product of affinity and efficacy of a test agonist relative to a standard agonist, these values will be determined through Furchgott analysis in CHO-M2 cells measuring the inhibition of cAMP production with various muscarinic agonists (oxotremorine-M, oxotremorine, arecoline, S-aceclidine, pilocarpine, bethanechol and McN-A-343) against a standard agonist (carbachol). Our results suggest that RAi values are equivalent to the product of affinity and efficacy. The RAi analysis (null and operational method) of the various muscarinic agonist using control agonist-induced inhibition of cAMP data such as the control oxotremorine and carbachol data seen in figure 1a and, the comparison of this parameter with the product of affinity and efficacy of those same agonists determined through the use of Furchgott analysis. Mean values ± SEM for three to eight experiments are shown. Table 1 Methods Furchgott analysis. Pairs of agonist concentrations yielding the same level of inhibition of cAMP accumulation before and after receptor inactivation by 4-DAMP mustard are plotted on a graph (Fig. 1b) and analyzed by the following equation: 1 The agonist concentrations before and after receptor alkylation are denoted by x and x’, respectively. Non-linear regression of equation 1 will result in values for Kd, which denotes the dissociation constant of the agonist, and q, which represents the residual amount of receptors remaining after 4-DAMP mustard treatment. Relative intrinsic efficacy can be determined by comparing the test agonist against a standard agonist by estimating the amount of occupancy needed for each agonist to elicit the same level of response. A plot of responses measured (inhibition of cAMP response) versus occupancy (Fig. 1c) for each agonist can be made by determining the occupancy that corresponds to each level of response knowing the Kd: 2 Knowing the affinity and efficacy values for the test agonist and standard agonist, the product of the two can be made in the following manner: 3 RAi analysis. All that is needed for this analysis is the control curves for the test agonist and standard agonist. The methods to calculate the intrinsic relative activity of an agonist in this type of situation may include the null method and/or the operational method of RAi calculation (Griffin et al, 2007). The null method involves comparing equiactive agonist concentrations by plotting a graph and fitting the points to the following equation: 4 5 Bi and Ai denote the ith concentrations of the test agonist (B) and standard agonist (A), repectively. KA denotes a constant for the affinity of the standard agonist that was fixed for nonlinear regression to determine p and q, where p equals KB/KA while q equals eB/eA. The operational method of RAi analysis is achieved by fitting the concentration response curves of each of the agonists to the following equation: 6 7 R denotes the agonist response while Xj denotes the concentration of agonist A or B. Msys and m denote the maximal response of the system and the slope factor, respectively. Non-linear regression, holding KA constant, will yield tj (tA, tB) and KB estimates. RAi values have been shown previously (Ehlert et al., 1996; Ehlert et al., 1999; Ehlert and Griffin, 2001)to be mathematically equivalent to equation 3. The Kd, product of affinity and efficacy and RAivalues of the various agonist used in the inhibition of forskolin-stimulated cAMP production. The log mean values ± SEM values are shown in parenthesis. • Conclusions • The RAivalues for the agonist-mediated inhibition of cAMP production in CHO-M2 cells correlate with the product of affinity and efficacy of the test agonists (oxotremorine-M, oxotremorine, arecoline, S-aceclidine, pilocarpine, bethanechol and McN-A-343) relative to a standard agonist, carbachol. The affinity and efficacy values were determined by Furchgott analysis. • The RAi analysis requires less time because the analysis involves only the control agonist response curves unlike Furchgott analysis where an irreversible antagonist, which here is 4-DAMP mustard, is necessary. • RAi values should not vary between responses measured and systems utilized because the parameter is the product of affinity and efficacy for the agonist-receptor-G protein, properties that are inherent to the complex. • RAi analysis can be used as tool to identify the agonist- receptor complexes that are the same between different responses measured and/or systems utilized even though their EC50 and Emax values vary. This analysis also can be used to characterize agonist-receptor behavior such as agonist-directed signaling or the existence of receptor activity modifying proteins by showing different RAi values even though the agonist-receptor complex is the same. The inhibition of forskolin-stimulated cAMP accumulation in CHO-M2 cells (a) by carbachol (open circles), oxotremorine-M (open triangles) and 4-DAMP mustard treatment (closed symbols). Mean values ± SEM are shown from five to eight experiments. Furchgott analysis (b, c) using equation 1 to determine agonist affinity (b; Kd values are shown in Table 1) and equation 2 to determine the relative efficacy (e; c) of oxotremorine-M compared to carbachol. This analysis is done using the mean data found in a. References Ehlert FJ and Griffin MT (2001) Estimation of agonist activity and relative efficacy at G protein-coupled receptors: mutational analysis and characterization of receptor subtypes. Annalytical Pharmacology2:34-47. Ehlert FJ, Griffin MT and Glidden PF (1996) The interaction of the enantiomers of aceclidine with subtypes of the muscarinic receptor. J Pharmacol Exp Ther279:1335-1344. Ehlert FJ, Griffin MT, Sawyer GW and Bailon R (1999) A simple method for estimation of agonist activity at receptor subtypes: comparison of native and cloned M3 muscarinic receptors in guinea pig ileum and transfected cells. J Pharmacol Exp Ther289:981-992. Furchgott RF (1966) The use of b-haloalkylamines in the differentiation of receptors and in the determination of dissociation constants of receptor-agonist complexes. Adv. Drug Res.3:21-55. Furchgott RF and Bursztyn P (1967) Comparison of dissociation constants and relative efficacies of selected agonists acting on parasympathetic receptors. Ann. New York Acad. Sci.144:882-899. Griffin MT, Figueroa KW, Liller S and Ehlert FJ (2007) Estimation of Agonist Activity at G Protein Coupled Receptors: Analysis of M2 Muscarinic Receptor Signaling through Gi/o, Gs and G15. J Pharmacol Exp Ther.