Download
1 / 11
110 likes | 113 Views
Investigating a magnetic structure by neutron diffraction: a true life story.

E N D
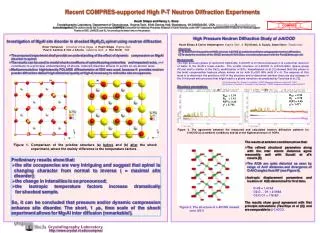
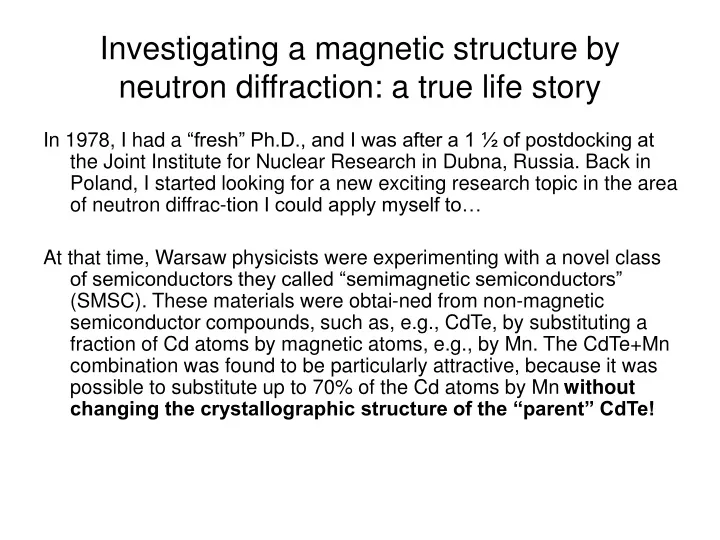
Investigating a magnetic structure by neutron diffraction: a true life story In 1978, I had a “fresh” Ph.D., and I was after a 1 ½ of postdocking at the Joint Institute for Nuclear Research in Dubna, Russia. Back in Poland, I started looking for a new exciting research topic in the area of neutron diffrac-tion I could apply myself to… At that time, Warsaw physicists were experimenting with a novel class of semiconductors they called “semimagnetic semiconductors” (SMSC). These materials were obtai-ned from non-magnetic semiconductor compounds, such as, e.g., CdTe, by substituting a fraction of Cd atoms by magnetic atoms, e.g., by Mn. The CdTe+Mn combination was found to be particularly attractive, because it was possible to substitute up to 70% of the Cd atoms by Mn without changing the crystallographic structure of the “parent” CdTe!
Warsaw physicists started “torturing” the new material, Cd1-xMnxTe, with all experimental tools they had, and soon it was established that it exhibits pronounced antiferromagnetic (AFM) properties. • However, they wanted to know more details about that AFM structure. In Cd1-xMnxTe the metallic ions form a FCC lattice, and there are several possible types of AFM ordering in such lattice!
As shown by the phase diagram below, the type of AFM order that forms depends on the signs and relative strength of the exchange coupling between the nearest and next-nearest spin neighbors: This is a picture you already know – it shows the four known types of AFM ordering seen in FCC spin lattices: So, by determining the exact AFM structure type of Cd1-xMnxTe one could get valuable information about the exchange interactions in this system…
So, neutron diffraction studies of the system seemed to be the “next logical step”. However, neutron diffraction “big guys” who were approached flatly refused even to try! Because the “bad boy” in Cd1-xMnxTe is Cadmium! Cd has an extremely high neutron absorbtion cross section. Every physicist with experience in neutron diffraction knew and understood that neutrons, yes, would enter the sample, but none would be able to exit it and reach the detector! But I had nothing else to do at the moment, so I thought: Why shouldn’t I try? I can grind the material, make a very thin specimen, and then try to get a powder diffraction pattern… The “top Cd1-xMnxTe guru” at that time was a nice gentleman, professor R. R. Galazka. I approached him and told him about my project, and asked for a few grams of the stuff with the highest possible Mn concentration, 70%, in order to minimize the absorbtion.
The “top Cd1-xMnxTe guru” at that time was a nice gentleman, professor R. R. Galazka. I approached him and told him about my project, and asked for a few grams of the stuff with the highest possible Mn concen- tration, 70%, in order to minimize the Cd absorbtion. Prof. Galazka was sympathetic, but a bit skeptic. And he said: You know, the crystals with 70% of Mn are really difficult to grow… And you want to powder your sample… I would hesitate… But I can give you a few grams of 50% stuff, much easier to prepare. Try it, and if the initial results are optimistic, I’ll give you a 70% sample.
So, I took the sample, and I made a run, first at room tempe- rature (blue points). Structural peaks (111) and (200) showed up, so it was not so bad! Next, I cooled down the sample to liquid nitro- gen temperature, 78 K. It seemed that there was a slight intensity increase in this region… The next “logical step” was to further lower the temperature, to liquid He (T=4.2 K). Liquid He was then in short supply in Poland. I finally got the 6 liters I needed just a day before Christmas 1978… And Bingo! Santa Claus really ex- ists! No doubt, there was a peak!
When Professor Galazka saw the results, he rushed to prepare a special 70% sample for me. A few weeks later, I made the measurement. The peak was indeed more pronounced, as you can see… But good luck and bad luck often “pair up”. In the middle of the run, a leak developed in the vaccum system of my cryostat… It was no chance to repair it, so I could not get to the region where the structural Bragg peaks were…
Fortunately, neutron scatterers from Denmark offered their help! They gave me a week of beamtime at their magnificent reactor at Risoe National Lab (not far from Kopenhagen). And plenty of liquid helium! So, I repeated the experiment at Risoe and now I got the whole spectrum. But, surprisingly, there were too many “extra peaks. The highest peak in the diffraction pattern made no sense at all…
But the riddle was soon solved. It turned out that the sample was contaminated with nitrogen, which froze at liquid He temperature. The mysterious “extra peak” was simply from “nitrogen ice”. After removing nitrogen from the powder, I got a pattern in which two peaks were evidently magnetic, consistent with the Type III AFM order.
To get a proof that was even more convincing, we studied the dependence of the (1, ½ , 0) AFM peak, and the (2, 0, 0) structural peak on temperature. As expected, with increasing T the AFM peak gradually decreased in intensity, whereas the structural peak remained almost unchanged.
In summary: the measurements revealed magnetic peaks in the diffraction patterns, which could be identified as (1 0 ½ ) and (2 1 ½). Such peaks are a clear “signature” of the Type III AFM order. It offered the first information about the exchange constants in the Cd1-xMnxTe system – namely, that both J1 and J2 are < 0, i.e., anti- ferromagnetic, and that J1 is the “dominant” one because the Type III order is stable for |J2|< ⅓|J1|. However, diffraction studies could only provide a rough estimate of the J1magnitude (based on the temperature behavior of the magnetic peaks). A precise value of J1 = 0.53 meV was obtained a few years later using magnetization step spectroscopy (by a team led by Y. Shapira, who invented this technique). The details of the method are outlined in another PPT presentation. Later, this value was confirmed by our OSU Team by measurements of inelastic neutron scattering from Mn-Mn pairs in Cd0.95Mn0.05Te samples. An accurate value of J2 was never obtained. However, thorough analysis of the magnetization step spectra done by Y. Shapira team led to the conclusion that this value has to be extremely small – perhaps as low as only 1% of J1 . But even such a small value is still consistent with the Type III order.