Download
1 / 6
60 likes | 112 Views
Step 1: Graph the vertex, which is the y -intercept (0, 1). Step 2: Make a table of values to find some points on one side of the axis of symmetry x = 0. Graph the points. 1. 1 3. x y. 2 2. 3 4. 4 6. 1 3. 1 3. 1.

E N D
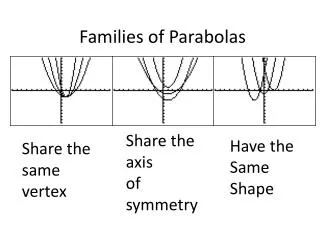
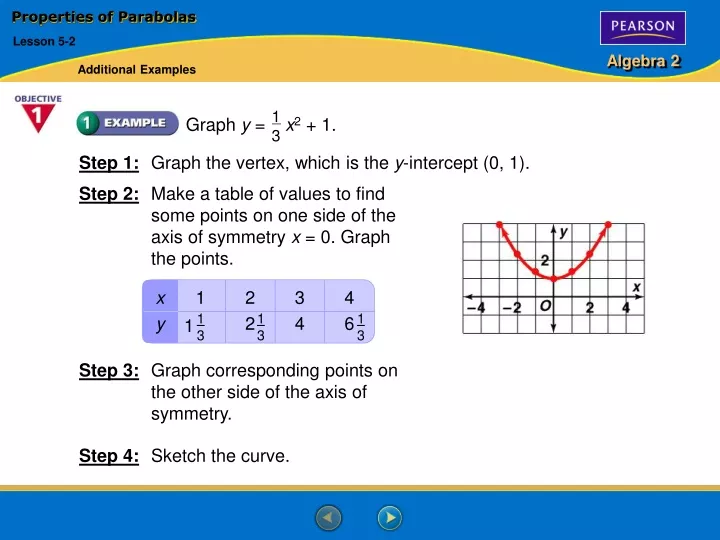
Step 1: Graph the vertex, which is the y-intercept (0, 1). Step 2: Make a table of values to find some points on one side of the axis of symmetry x = 0. Graph the points. 1 1 3 x y 2 2 3 4 4 6 1 3 1 3 1 Step 3: Graph corresponding points on the other side of the axis of symmetry. Step 4: Sketch the curve. Properties of Parabolas Lesson 5-2 Additional Examples 1 3 Graph y = x2 + 1.
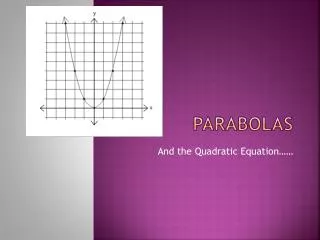
Step 1: Find and graph the axis of symmetry. b 2a 1 2( ) x = – = – = –1 1 2 Step 2: Find and graph the vertex. The x-coordinate of the vertex is –1. The y-coordinate is y = (–1)2 + (–1) + 3 = 2 . So the vertex is (–1, 2 ). 1 2 1 2 1 2 Step 3: Find and graph the y-intercept and its reflection. Since c = 3, the y-intercept is (0, 3) and its reflection is (–2, 3). Properties of Parabolas Lesson 5-2 Additional Examples 1 2 Graph y = x2 + x + 3. Name the vertex and axis of symmetry.
Step 5: Sketch the curve. Properties of Parabolas Lesson 5-2 Additional Examples (continued) Step 4: Evaluate the function for another value of x, such as y = (2)2 + (2) + 3 = 7. Graph (2, 7) and its reflection (–4, 7). 1 2
b 2a 2 2(– ) x = – = – = 4 Find the x-coordinate of the vertex. 1 4 1 4 y = – (4)2 + 2(4) – 3 = 1 Find the y-coordinate of the vertex. Graph the vertex and the axis of symmetry x = 4. Graph two points on one side of the axis of symmetry, such as (6, 0) and (8, –3). Then graph corresponding points (2, 0) and (0, –3). The maximum value of the function is 1. Properties of Parabolas Lesson 5-2 Additional Examples 1 4 Graph y = – x2 + 2x – 3. What is the maximum value of the function? Since a < 0, the graph of the function opens down, and the vertex represents the maximum value. Find the coordinates of the vertex.
Relate: revenue equals price times number of get-away packages sold Define: Line R = revenue. Let p = price of a get-away package. Let –0.12p + 60 = number of a get-away packages sold. Write:R = p ( –0.12p + 60 ) = –0.12p2 + 60pWrite in standard form. Properties of Parabolas Lesson 5-2 Additional Examples The number of weekend get-away packages a hotel can sell is modeled by –0.12p + 60, where p is the price of a get-away package. What price will maximize revenue? What is the maximum revenue?
Properties of Parabolas Lesson 5-2 Additional Examples (continued) Find the maximum value of the function. Since a < 0, the graph of the function opens down, and the vertex represents a maximum value. b 2a 60 2(–0.12) p = – = – = 250 Find p at the vertex. R = –0.12(250)2 + 60(250) Evaluate R for p = 250 = 7500 Simplify. A price of $250 will maximize revenue. The maximum revenue is $7500.