Download
1 / 1
10 likes | 79 Views
Figure 6. Spacing of live pines and among all standing pine stems (live or dead) in Range Pond State Park near Plains Road in January 2006. Bars represent the mean ± SD. Figure 3. Height distribution of dead white stems in Range Pond State Park near Plains Road in January 2006. Height

E N D
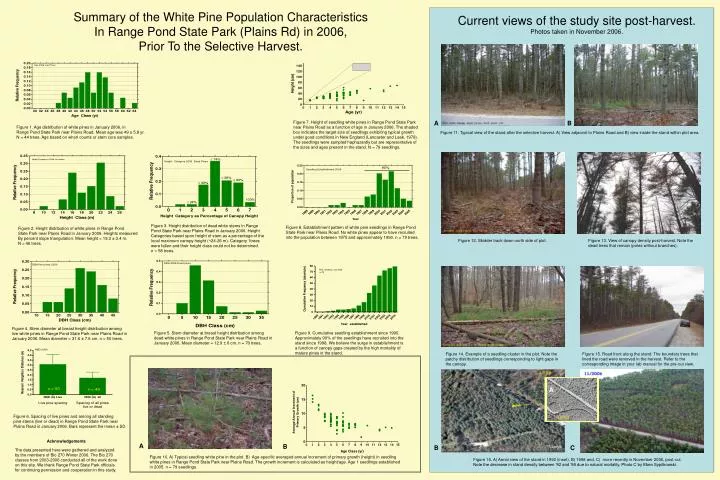
Figure 6. Spacing of live pines and among all standing pine stems (live or dead) in Range Pond State Park near Plains Road in January 2006. Bars represent the mean ± SD. Figure 3. Height distribution of dead white stems in Range Pond State Park near Plains Road in January 2006. Height Categories based upon height of stem as a percentage of the local maximum canopy height (¬24-26 m). Category 1trees were fallen and their height class could not be determined. n = 58 trees. A B Figure 11. Typical view of the stand after the selective harvest. A) View adjacent to Plains Road and B) view inside the stand within plot area. Figure 7. Height of seedling white pines in Range Pond State Parknear Plains Road as a function of age in January 2006. The shaded box indicates the target size of seedlings exhibiting typical growthunder good conditions in New England (Lancaster and Leak, 1978).The seedlings were sampled haphazardly but are representative ofthe sizes and ages present in the stand. N = 79 seedlings. Figure 8. Establishment pattern of white pine seedlings in Range PondState Park near Plains Road. No white pines appear to have recruited into the population between 1975 and approximately 1990. n = 79 trees. Figure 2. Height distribution of white pines in Range Pond State Park near Plains Road in January 2006. Heights measured By percent slope triangulation. Mean height = 19.3 ± 3.4 m. N = 46 trees. Figure 13. View of canopy density post-harvest. Note the dead trees that remain (poles without branches). Figure 12. Skidder track down north side of plot. Figure 9. Cumulative seedling establishment since 1990. Approximately 90% of the seedlings have recruited into the stand since 1998. We believe the surge in establishment isa function of canopy gaps created by the high mortality of mature pines in the stand. Figure 4. Stem diameter at breast height distribution among live white pines in Range Pond State Park near Plains Road in January 2006. Mean diameter = 31.6 ± 7.6 cm. n = 50 trees. Figure 1. Age distribution of white pines in January 2006, in Range Pond State Park near Plains Road. Mean age was 49 ± 5.8 yr. N = 44 trees. Age based on whorl counts or stem core samples. Figure 5. Stem diameter at breast height distribution among dead white pines in Range Pond State Park near Plains Road in January 2006. Mean diameter = 12.9 ± 6 cm. n = 70 trees. Figure 14. Example of a seedling cluster in the plot. Note the patchy distribution of seedlings corresponding to light gaps inthe canopy. Figure 15. Road front along the stand. The boundary trees that lined the road were removed in the harvest. Refer to the corresponding image in your lab manual for the pre-cut view. A Summary of the White Pine Population Characteristics In Range Pond State Park (Plains Rd) in 2006, Prior To the Selective Harvest. Current views of the study site post-harvest. Photos taken in November 2006. Acknowledgements A B B C The data presented here were gathered and analyzedby the members of Bio 270 Winter 2006. The Bio 270classes from 2003-2006 conducted all of the work doneon this site. We thank Range Pond State Park officialsfor continuing permission and cooperation in this study. Figure 10. A) Typical seedling white pine in the plot. B) Age-specific averaged annual increment of primary growth (height) in seedling white pines in Range Pond State Park near Plains Road. The growth increment is calculated as height/age. Age 1 seedlings established in 2005. n = 79 seedlings. Figure 16. A) Aerial view of the stand in 1992 (inset), B) 1998 and, C) more recently in November 2006, post-cut. Note the decrease in stand density between ’92 and ’98 due to natural mortality. Photo C by Eben Sypitkowski.