Download
1 / 145
1.45k likes | 1.74k Views
www.drsarma.in. Glucose Homeostasis Counter Regulation Dr.Sarma.R.V.S.N M.D., (Med) M.Sc., (Canada) Consultant Physician and Chest Specialist. Glucose Equilibrium – A Wonder !!. Normal Blood Glucose Fasting state : 60 to 100 mg% Postprandial : 100 to 140 mg %

E N D
www.drsarma.in Glucose Homeostasis Counter Regulation Dr.Sarma.R.V.S.N M.D., (Med) M.Sc., (Canada) Consultant Physician and Chest Specialist
Glucose Equilibrium – A Wonder !! • Normal Blood Glucose • Fasting state : 60 to 100 mg% • Postprandial : 100 to 140 mg % • What keeps the blood glucose in such a narrow range? • Why are we not becoming hypoglycemic when we fast? • Why is our blood sugar not shooting up to very high levels after a rich meal ? • What are the regulatory and counter regulatory hormones ?
Glucose Equilibrium – A Wonder !! • Normal Blood Glucose • Fasting state : 60 to 100 mg% • Postprandial : 100 to 140 mg % • What keeps the blood glucose in such a narrow range? • Why are we not becoming hypoglycemic when we fast? • Why is our blood sugar not shooting up to very high levels after a rich meal ? • What are the regulatory and counter regulatory hormones ? Let us grasp some of the fascinating answers !!
Glucose Homeostasis Research Timeline 1552BC 1st Century AD 1776 18th Century 1869 1889 1921-23 1983 2001 • 1552 BC: Ebers Papyrus in ancient Egypt. First known written description of diabetes. • 1st Century AD: Arateus — “Melting down of flesh and limbs into urine.” • 1776: Matthew Dobson conducts experiments showing sugar in blood and urine of diabetics. • Mid 1800s: Claude Bernard studies the function of the pancreas and liver, and their roles in homeostasis. • 1869: Paul Langerhans identifies cells of unknown function in the pancreas. These cells later are named “Islets of Langerhans.” • 1889: Pancreatectomized dog develops fatal diabetes. • 1921: Insulin “discovered” — effectively treated pancreatectomized dog. • 1922: First human treated with insulin. Eli Lilly begins mass production. • 1923: Banting and Macleod win Nobel Prize for work with insulin. • 1983: Biosynthetic insulin produced. • 2001: Human genome sequence completed.
Cell growth and energy metabolism Carbohydrates Glucose Pyruvate CoA Fatty acids Fats Amino acids Acetyl-CoA TCA Cycle Kreb’s Cycle Proteins ATP
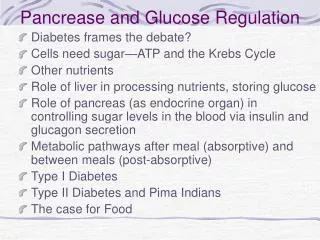
Intermediary Metabolism of Fuels • Clinical Pearl • All the fuels are inter changeable in the body • It is the total calorie restriction that is important in Obesity and T2D
Glucose-6-Phosphate – The Central Molecule Clinical Pearl G-6-Phosphate is the Center Stage for CHO Metabolism Glucose-6-Phosphate dehydrogenase (G6PD) is the crucial enzyme
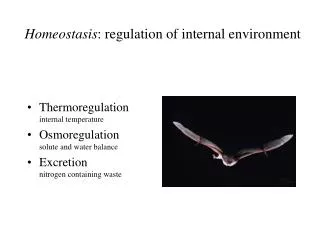
Homeostasis of Glucose Counter Regulation Mechanisms • A steady maintenance of blood glucose with in a narrow range • Fasting state and fed states – their effects on BG • Rate of glucose appearance Ra • Rate of disappearance Rd must be in balance • Blood Glucose (BG) = Ra - Rd • Control systems • Glucose Receptors, GLUT 1-14 • Controlling Hormones, Insulin, Glucagon, Cortisol, Epinephrine etc., • Insulin Signaling sequences, Glucagon signaling • Effector Cells – Muscles, Liver, Brain, Heart and Adipose tissue • Feedback loops • Negative feedback • Positive feedback
Homeostasis of Glucose Counter Regulation Mechanisms • A steady maintenance of blood glucose with in a narrow range • Fasting state and fed states – their effects on BG • Rate of glucose appearance Ra • Rate of disappearance Rd must be in balance • Blood Glucose (BG) = Ra - Rd • Control systems • Glucose Receptors, GLUT 1-14 • Controlling Hormones, Insulin, Glucagon, Cortisol, Epinephrine etc., • Insulin Signaling sequences, Glucagon signaling • Effector Cells – Muscles, Liver, Brain, Heart and Adipose tissue • Feedback loops • Negative feedback • Positive feedback Clinical Pearl INSULIN v/s GLUCAGON and Rd V/s Ra
Ra 100 mg Rd Ra Ra Ra Ra 200 mg 200 mg 50 mg 50 mg Rd Rd Rd Rd HYPOGLYCEMIA HYPERGLYCEMIA Normal, Hyper and Hypoglycemic states Ra is the rate of appearance of Glucose Rd is rate of disappearance of Glucose When Ra = Rd; It is Euglycemic state Ra > Rd; Ra ↑or Rd↓ Ra < Rd; Ra ↓or Rd ↑
Exogenous CHO GLUCAGON INSULIN Effect of CHO intake on Glucose Metabolism Gluconeogenesis Glycogenolysis Lipolysis Ra Rd
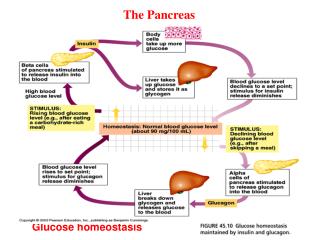
Lower Blood Glucose Between meals -cells release Glucagon stimulate glycogen breakdown and gluconeogenesis -cells release insulin stimulate glucose uptake by peripheral tissues Higher Blood Glucose Food Glucose Homeostasis
Pancreas Exocrine Pancreas – P Lipase, P amylase etc Endocrine Pancreas – Islets of Langerhans Hormones secreted are – Alpha cells – Glucagon Beta cells – Insulin C cells - Somatostatin D cells - Somatostatin E cells - ?? Function F cells - Pancreatic polypeptide (PPP) PancreaticHormones
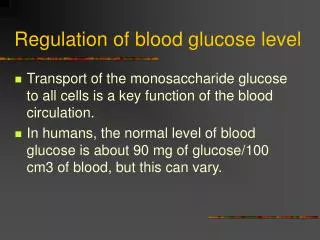
Glucose is the major source of energy for cells Blood Glucose (BG) regulated by Insulin & Glucagon Regulation of Blood Glucose levels
Glucose Homeostasis – Insulin and Glucagon Regulation of beta-cell size by the level of blood glucose
Condition High Blood Sugar Toxic to the cells - AGP Low Blood Sugar Energy needs unmet Receptor Glucose transporter Glucose transporter -cell of the pancreas -cell of the pancreas Control Center Insulin Glucagon Effector Glucose uptake by muscle/fat tissue Lowers blood glucose Liver breaks down glycogen to glucose Raises blood glucose Result Glucose Homeostasis Chart
The Six Mechanisms of Transport - CM 2 1 3 6 4 5
Glucose Transport FIRST STEP GLUCOSE ABSORPTION IN THE GI TRACT
Intestinal Cell Transport Clinical Pearl New approach in T2D, MS and Obesity - GLUT-2 Blockers
The First Messengers from GI tract THE MESSERGERS INCRETINS – GLP1 and GIP_
Entero-Insular Axis of Secretion Insulin secretion is also increased • By intestinal polypeptide hormones • GLP-1 (glucagon like peptide) [exendin-4] • Glucose-dependent insulinotropic peptide(GIP) • GLP-1 and GIP are called Incretins • Cholecystokinin and by pancreatic Glucagon. • Insulin secretion is decreased by pancreatic somatostatin.
Entero-Insular Axis of Secretion Insulin secretion is also increased • By intestinal polypeptide hormones • GLP-1 (glucagon like peptide) [exendin-4] • Glucose-dependent insulinotropic peptide(GIP) • GLP-1 and GIP are called Incretins • Cholecystokinin and by pancreatic Glucagon. • Insulin secretion is decreased by pancreatic somatostatin. Clinical Pearl New Drugs for T2D- Incretin (GLP-1 and GIP) Function Enhancers
Response to Elevated Blood Glucose In the post prandial state (after a meal) • Remember there are two separate signaling events • First signal is from the ↑ Blood Glucose to pancreas • To stimulates insulin secretion in to the blood stream • The second signal from insulin to the target cells • Insulin signals to the muscle, adipose tissue and liver to permit to glucose in and to utilize glucose • This effectively lowers Blood Glucose
Response to Elevated Blood Glucose In the post prandial state (after a meal) • Remember there are two separate signaling events • First signal is from the ↑ Blood Glucose to pancreas • To stimulates insulin secretion in to the blood stream • The second signal from insulin to the target cells • Insulin signals to the muscle, adipose tissue and liver to permit to glucose in and to utilize glucose • This effectively lowers Blood Glucose • Clinical Pearl • Insulin secretion must be triggered – First Signal • Secreted Insulin must trigger Glucose uptake – Second signal • T2D may result from failure of either or both
Glucose induced Insulin secretion • Glucose enters the beta cells through uniporter GLUT 2 • Oxidative phosphorylation • ATP closes the ATP gated K+ channel and depolarizes the cell membrane • Depolarization opens the voltage gated Ca+ channels • Ca+ enters the beta cells • This leads to exocytosis of Insulin and secretion
Glucose induced Insulin secretion • Glucose enters the beta cells through uniporter GLUT 2 • Oxidative phosphorylation • ATP closes the ATP gated K+ channel and depolarizes the cell membrane • Depolarization opens the voltage gated Ca+ channels • Ca+ enters the beta cells • This leads to exocytosis of Insulin and secretion Clinical Pearl Closure of KATP Channels by Glucose is fundamental Glucose is necessary to stimulate Insulin Insulin is necessary to let in glucose
K+ATP Channel Closed by ↑ BG and SU • Clinical Pearl • SU Group close KATP Channels – Secrete Insulin • Differences in action of SU are because of the differences • in their action on KATP Channels • 3. Gliclazide and Glimiperide just hit the SUR closure and stop
K+ATP – Sulfonylurea Receptor • K+ATP channel has two sub units – Kir6.2 and regulatory sulfonylurea receptor(SUR) • ATP gated K+ channel is coupled to SUR • K+ channel can be closed independently of glucose • This leads to increased insulin secretion • SUR1 are ATP binding transporters superfamily
K+ATP – Sulfonylurea Receptor • K+ATP channel has two sub units – Kir6.2 and regulatory sulfonylurea receptor(SUR) • ATP gated K+ channel is coupled to SUR • K+ channel can be closed independently of glucose • This leads to increased insulin secretion • SUR1 are ATP binding transporters superfamily • Clinical Pearl • Glibenclamide, Tolbutamide cause prolonged closer of the SUR • This causes prolonged and intense pressure on Beta cells • This is the cause of late hypoglycemia with these SUs • Beta cell apoptosis sets in fast after a few years of use
(F)PHHI • (Familial) Persistent Hyperinsulinemic Hypoglycemia of Infancy • Unregulated insulin secretion • Profound hypoglycemia and brain damage • Manifests at birth or at first year of life • Under diagnosed • Probably the cause of undiagnosed postnatal deaths • Defect is KATP Channels mutation – • Persistent closure with continuous trigger for Insulin release • Treatment is pancreatectomy – (95% of pancreas)
K+ATP Channel Opening is Cardio-protective • Clinical Pearl • Glibenclamide, Tolbutamide close the SUR in myocardium • This effect is deleterious to heart in ischemia
Tyrosine Kinase Pathway - Insulin • Clinical Pearl • Tyrosine Kinase (TK) phosphorylation is the fundamental step • Its failure stops further cascade of intracellular signals • This is one of the possible mechanisms of Insulin Resistance • PPAR- Gamma (Pioglitazone) enhances TK signaling pathway
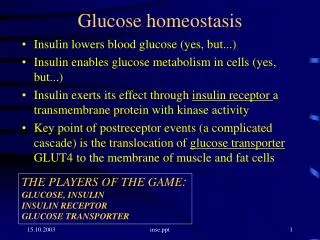
Insulin Receptor (IR) • Insulin Receptor is a tyrosine kinase. • Consists of 2 units -dimerize when bound with insulin. • Inside cell - auto phosphorylation occurs, • Increasing tyrosine kinase activity. • Insulin Receptor phosphorylates intracellular signaling molecules. • Stimulates insertion of GLUT-4 proteins • which let in glucose • Stimulate glycogen, fat and protein synthesis.
S S Insulin S S S S S S +3HN NH3+ -subunits -S-S- EXTRACELLULAR -OOC - COO +3HN NH3+ Plasma CYTOPLASM membrane Transmembrane domain Tyrosine kinase domain -OOC COO- -subunits Figure 2. The insulin receptor. Insulin binding to the -chains transmits a signal through the transmembrane domain of the -chains to activate the tyrosine kinase activity
3 2 IRTK (R) phosphorylated/ activated 1 IRTK (L) activated insulin binds OP OP L R Phosphorylation catalyzed by IRTK (L) Extracellular P P P Cytoplasm P P ATPs ADPs Figure 3. Activation of the tyrosine kinase domains of the insulin receptor by insulin binding, followed by interchain autophosphorylation
3 2 IRTK (R) phosphorylated/ activated 1 4 IRTK (L) activated IRTK (L) phosphorylated insulin binds PO OP OP OP PO OP L R ATPs ADPs ATPs ADPs Phosphorylation catalyzed by IRTK (L) Extracellular P P P P P P Cytoplasm Figure 3. Activation of the tyrosine kinase domains of the insulin receptor by insulin binding, followed by interchain autophosphorylation
Insulin Signaling – TK Receptor phosphorylation Binding of insulin to the TK Receptor causes • Transphosphorylation of tyrosines on the receptor • Phosphotyrosine residues bind to • IRS-1 (insulin receptor substrate – adopter protein)
Insulin Receptor (IR) A key regulator of growth signaling • IR is hetero-tetramer • Insulin binding induces conformation change and stimulation of receptor Tyrosine kinase activity • IR auto-phosphorylates and phosphorylates downstream second messengers, like IRS (Insulin Receptor Substrate) • Obesity down regulation of IR • Diabetes up regulation of IR