Download

1 / 29
290 likes | 412 Views
Problems of transforming scales of life satisfaction. Euromodule workshop Berlin, 18-19 October 2002 Sergiu Bălţătescu University of Oradea. Life satisfaction. Defined as an overall, cognitive evaluation of one's life. A construct generally measured by single direct questions

E N D
Problems of transforming scales of life satisfaction Euromodule workshop Berlin, 18-19 October 2002 Sergiu Bălţătescu University of Oradea
Life satisfaction • Defined as an overall, cognitive evaluation of one's life. • A construct generally measured by single direct questions • Single scales: two formulation of the questions: • referring to the 'satisfaction with the life one leads’ • referring to 'satisfaction with life-as-a-whole’ • Scales with 3, 4, 5 points • with answer categories verbally labeled • Scales with 10, 11 and 101 points • represented on a pseudo-graphic scales, • only the extreme values are represented verbally. (Veenhoven, 1993)
Why we need knowledge about the transformation of life satisfaction scales ? • PRACTICAL REASONS: To homogenize life satisfaction data, in order to compare levels of subjective well-being: • between nations • through time Examples: - compare national life satisfaction means of Euromodule and non-Euromodule countries • make compatible the time-trend of life satisfaction obtained with another survey program (Diagnosis of quality of life 1990-1999) with Euromodule Romania (2003? -
Why we need knowledge about the transformation of life satisfaction scales ? • THEORETICAL REASONS: • Assess the convergent validity of new measures • Example: results from new international programs (like Euromodule) can be compared with the results of other national surveys which are using different life satisfaction scales. • Analyze through conversion some characteristics of life satisfaction scale used. • Example: which level of measurement can be assessed to life satisfaction scale we use - ordinal or interval ?
The initial scale • Used in ‘Diagnosis of quality of life’ survey program (ICCV, 1990-1999) (for the analysis was used the 1999 data set) • Sample: national, random, around 1200 cases A 5-point simple life satisfaction scale: “Considering the whole situation, how satisfied are you about your daily life? a. Very unsatisfied b.Unsatisfied c.Neither unsatisfied, nor satisfied d.Satisfied e.Very satisfied” See: Mărginean (1991), Zamfir (1992) See also: www.iccv.ro
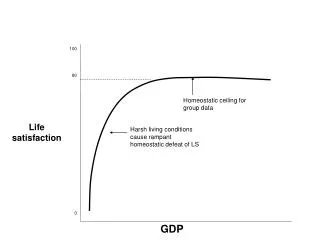
Distribution of the initial variable (Diagnosis of Quality of life 1999) • Mean: 2,71 (under the mean value of the scale) • Slightly positively skewed • See next the graphic representation of the distribution
The target scale • 11-point pseudo-interval scale • Only the extremes are represented verbally • Has graphic elements • Used in the Euromodule questionnaire See: Delhey, J., P. Bohnke, et al. (2002).
Goals for transforming life satisfaction scales • A. Convert an ordinal scale into another • Ex: a 5-step life satisfaction scale intoan 11-step life satisfaction scale • B. Assigning interval values to an ordinal scale • Ex: assign scores for each answers on a 5-step life satisfaction scale, and assess the true (empirical) distance between the categories • C. Combining the two approaches
Methods for converting an ordinal scale into another • 1. Linear (conventional) transformation • the simplest way to convert scales, using an unique formula • used implicitly for homogenizing means of life satisfaction scales in World Database of Happiness (Veenhoven, 1993) • 2. Transformation by expert ratings • the analyst, a panel of expert researchers or typical respondents are assigning to each category of the original scale a value (or category) on the target variable • Ex: very unsatisfied-3, somehow satisfied - 6, very satisfied - 9
Linear (conventional) transformation Formula used for converting into a 11 point scale Ai - A0 Bi = ___________ x 10 An - A0 where Bi = Transformed value (to 11-point scale) Ai = Value on original scale A0 = Lowest possible score on original scale An = Highest possible score on original scale (Veenhoven, 1993) Examples: For a 5-point Likert scale (assumed with equal intervals, with values from 1 to 5), the transformed values are: 0, 2.5, 5, 7.5, 10 Proprieties: • formula is designed in such a way that the end-points of the original scale coincide after transformation with the endpoints of the target (0-10) scale. • while stretching the scale, the linear transformation preserves the initial distances between the values. That is why it can be used also for transforming scales whose categories are at non-equal distances. See later how useful can be this feature.
Ratings of typical respondents Typical respondents: Sample of students from the University of Oradea (N=116) • Specialization: Sociology, Social work • Sex: Males 14 %, Females: 86 % • Age mean: 22 They were asked to rate the categories of the 5-step life satisfaction scale: a. On a graphic scale (10 cm. long). The distance of the signs to the left extremity was measured in cm. b. On a pseudo-interval scale (with graphic elements), as used in the Euromodule questionnaire See right the original questionnaire, in Romanian language
Ratings of the typical respondents • Means of the ratings have been calculated and plotted (line from every point to centroid point and regression line included) • 8 outliers (7% of ratings excluded from the analysis) • The resulted correlation between the mean of ratings on the two scales is high (r = 0.72) • Mean ratings on pseudo-interval scale was higher m(Xp)=5.19m(Xg)=4.94 • The assigned values for the categories were calculated as the mean of ratings of each category • The resulted ratings: Xp=(0.8; 2.440; 4.628; 6.973; 9.098) - on the pseudo-interval scale Xs=(1.16; 2.94; 5.03; 7.15; 9.00) - on the graphic scale
Assigning interval values to an ordinal scale • Estimation from the observed frequencies and distributional assumption • Optimal scoring
Estimation from the observed frequencies and distributional assumption • Used when researchers assumes that the latent variable has a particular distribution (ex: rectangular, normal) We can consider that observed categories correspond to separate segments under the density function of the latent variables For normal curve, we use a table of areas under the normal curve to estimate the upper & lower boundaries of each segment under the density function. After that, we calculate (or use a table of) the ordinates of the normal curve for the upper and lower boundaries. We substract the valueas and divides the results by a propostion of this category See: Hensler & Stipak (1979)
Computing of the estimation from the observed frequencies and distributional assumption Z values corresponding areas under the normal curve (-1,61; -0,77; 1,16; 2,49) Ordinates on the normal curve of Z values f(Z)=(0,1092; 0,2966; 0,2036; 0,018) Values of estimates calculated by subtracting ordinate of the lower boundary from the ordinate of the upper boundary and dividing by the proportion of each category xj=(-1,01111; -0,56276; 0,3; 0,793162; 1,384615) Scores linearly transformed to 0-10 scale (0; 1,87145; 5,472708; 7,531217; 10)
The optimal scoring method (OSM) • The algorithm is rather new (Young et al., 1981). • Precursors: Cattell (1962), Allen (1976), Hensler & Stipak (1979) • OSM begins with the premise that the problem of obtaining latent interval scores for ordinal variables is inherently insoluble. • Thus, we should use scoring systems which maximally simplify the empirical relationship within a set of variable. "Specifically, optimal scores are those which maximize the average inter-item correlation within a set of variables." (Allen, 1976) • The problem looks similar to that of maximizing the internal consistency of a set of variables. (calculating the Crombach - coefficient)
Regression with optimal scaling • Is a version of the optimal scoring method • Implemented in SPSS (CATREG algorithm) See Nichols (1995) • Represents a variant of linear regression in which the scores for the variables are not given before, but calculated after, in such a way that assures the best fit of the model (maximizing r square) • Practically, it stretches the measurement scales of the variables, assigning scores for their categories, to obtain a maximal fitness of the linear regression model, the only constraint being that of the monotonicity of variables. • Allows the theoretical model to prevail: if the researcher assumes that one of the variables is interval-level, this variable will be entered in the model as such, and its values will not be changed • Used recently for analyzing life satisfaction data (Shen & Lai, 1998)
Regression with optimal scaling as a method for transforming life satisfaction scales • Source data: Diagnosis of quality of life survey program (ICCV, 1990-1999) (for the analysis was used the 1999 data set) • Sample: national, random, 1198 cases • Dependent variable: life satisfaction • Independent variables: 19 domain satisfaction indicators (ex: satisfaction with family, with the political situation, neighborhood, etc.) • Theoretical model: bottom-up Results: The goodness of fit (r square) increases from 0,34 to 0,38 • New scores were assigned to life satisfaction indicator categories: (-1,827; -0,665; 0,186; 1,221; 3,729) • Scores linearly transformed to 0-10 scale (0; 2,091; 3,623; 5,485; 10)
Quantification of life satisfaction (By CATREG algorithm) The algorithm dramatically increases the distance between scores assigned to “satisfied” and “very unsatisfied” categories - to about a half of the amplitude on the target scale (see figure) As a result, the computed mean on 0-11 scale is lower than the means calculated by other methods (see next slide) Possible interpretation: it is very hard (or unusual) to be very satisfied in Romania Indeed, the percent of those who declared themselves being very satisfied is about 1,3 %
Evaluation of the methods: linear transformation • Preserves the ratio of initial distances between categories • Can be used to transform values assigned to rank-order categories • May cause problems because is thus designed that the end-point of the original scale coincide after transformation to the end-points of the target (0-10) scale, when in fact: • The panel of typical respondents assigned the end-points to 1 and 9 • In the surveys using 0-10 scales, the extreme categories are in very few cases chosen • It might be recommended to transform values to 1-9 scale, and use scores as if they are on a 0-10 scale
Evaluation of the methods: rating by experts • Is more complicated to use: we need a separate research to asses the value • The ratings tend to be close to the equal-interval assigning on a 0-9 scale (1,3,5,7,9) • It is recommended to be used for recent data (we cannot be sure the meaning of categories of life satisfaction is not changing in time)
Evaluation of the methods: estimation from the observed frequencies and distributional assumption • We cannot always assumes a normal distribution of the life satisfaction variable • This works in the case of Romania 1990-1999, where the distribution is close to normal • In western European countries, life satisfaction scores are markedly positively skewed (Cummins, 1998)
Evaluation of the methods: regression with optimal scaling • The value is very dissimilar with the other calculations (in our sample) • The calculated optimal scores may differ from a sample to another, as the structure of subjective well being differs • There is no guarantee that the final scoring reflects the true measurement level of the dependent variable, or the functional relationship between variables • The method is rather new and deserves further tests
Limitations • The analysis is not exhaustive. Several methods like linear testing both scales in the same sample (recommended by Veenhoven) maximin (Abelson & Tukey), psycholinguistic estimation, estimation from criterion variables (Hensler & Spiwak) and other variants of optimal scaling were omitted • The number of predictors in regression with optimal scaling was rather small. • A closer attention must be given to missing data analysis • The issue of transformation of the scales with or not with central points was omitted • There was no attention given to the semantic difference of terms between languages
Reference list Abelson, R. P., & Tukey, J. W. (1963). Efficient Utilization of Non-numerical Information in Quantitative Analisys: General Theory, the Case of Simple Rank-Order. Annals of Mathematical Statistics, 34(1347-69). Allen, M. P. (1976). Conventional and Optimal Interval Scores for Ordinal Variables. Sociological Methods & Research, 4(4), 475-494. Blalock, H. M. j. (1972). Social Statistics (2nd Edition ed.). New York: McGraw-Hill. Cattell, R. B. (1962). The relational simplex theory of equal interval and absolute scaling. Acta Psychologica, 20, 139-158. Cummins, R. A. (1998). The Second Approximation to an International Standard for Life Satisfaction. Social Indicators Research, 43(3), 307-334. Diener, E. (1994). Assessing Subjective Well-Being - Progress and Opportunities. Social Indicators Research, 31(2), 103-157. Fielding, A. (1997). On scoring ordered classifications. British Journal of Mathematical & Statistical Psychology, 50, 285-307. Fielding, A. (1999). Ordered Category Responses and Random Effects in Multilevel and Other Complex Structures: Scored and Generalized Linear Models.
Reference list Hensler, C., & Stipak, B. (1979). Estimating Interval Scale Values for Survey Item Response Categories. American Journal of Political Science, 23(3), 627-649. Jacoby, W. G. (1999). Levels of measurement and political research: An optimistic view. American Journal of Political Science, 43(1), 271-301. Kim, J.-O. (1975). Multivariate Analysis of Ordinal Variables. American Journal of Sociology, 81(261-298). Krieg, E. F. (1999). Biases induced by coarse measurement scales. Educational and Psychological Measurement, 59(5), 749-766. Labovitz, S. (1970). The Asignment of Numbers to Rank Order Categories. American Sociological Review, 35, 515-524. Labovitz, S. (1971). In defence of assigning numbers to ranks. American Sociological Review, 36, 521-522. Mãrginean, I. (1991). Analiza comparativã a calitãþii vieþii. Calitatea Vieþii, 2(3-4), 157-168. Mãrginean, I. (1991). Schiþã de indicatori ai calitãþii vieþii. Calitatea Vieþii, 2(3-4), 3-23. Nichols, D. P. (1995). USING CATEGORICAL VARIABLES IN REGRESSION. SPSS Keywords (www.spss.com), 56.
Reference list Obrien, R. M. (1981). Using Rank Category Variables to Represent Continuous-Variables - Defects of Common Practice. Social Forces, 59(4), 1149-1162. Obrien, R. M. (1982). Using Rank-Order Measures to Represent Continuous-Variables. Social Forces, 61(1), 144-155. Shen, S., M., & Lai, Y., L. (1998). Optimally Scaled Quality-of-Life Indicators. Social Indicators Research, 44(2), 225-254. Schuessler, K. F., & Fisher, G. A. (1985). Quality of Life Research and Sociology. Annual Review of Sociology, 1985, Vol. 11, 129-149. Spector, P. E. (1980). Ratings of Equal and Unequal Response Choice Intervals. Journal of Social Psychology, 112(1), 115-119. Stuart, A. (1954). The Correlation Between Variate-Values and Ranks in Samples from Distributions Having No Variance. British Journal of Statistical Psychology, 7, 37-45. Torgerson, W. S. (1958). Theory and methods of scaling. New York: Wiley. Veenhoven, R. (1993). Happiness in nations : subjective appreciation of life in 56 nations, 1946-1992. Rotterdam, Netherlands :: Erasmus University of Rotterdam, Department of Social Sciences, RISBO, Center for Socio-Cultural Transformation.
Reference list Veenhoven, R. (1995). World Database of Happiness. Social Indicators Research, 34(3), 299-313. Veenhoven, R. (1996). The study of life-satisfaction. In W. E. e. a. Saris (Ed.), A comparative study of satisfaction with life in Europe (pp. 11-48). Budapest: Eötvös University Press. Wilson, T. P. (1971). A critique of ordinal variables. Social Forces, 49, 432-444. Young, W. F. (1981). Quantitative analysis of qualitative data. Psychometrika, 46, 357-388. Zamfir, C. (1984). Indicatori şi surse de variaţie a calitãţii vieþii. Bucureşti: Ed. Academiei RSR. Zamfir, C. (1992). Determinanti ai calitãþii vieþii. Calitatea Vieþii, 3(2-4).