Download
1 / 6
60 likes | 183 Views
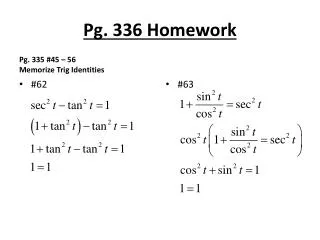
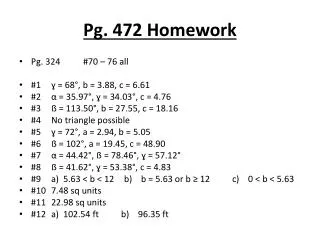
Pg. 277/292 Homework. Pg. 293 #21 – 34 all Pg. 301 #1 – 6 Pg. 277 #42. 5.4 Logarithmic Functions and Their Properties. We will look at the basic equation of but, we are not going to discuss the intricacies of graphing, just the parent function and parent graph.

E N D
Pg. 277/292 Homework • Pg. 293 #21 – 34 allPg. 301 #1 – 6Pg. 277 #42
5.4 Logarithmic Functions and Their Properties • We will look at the basic equation ofbut, we are not going to discuss the intricacies of graphing, just the parent function and parent graph. • No matter the “b”, what does this graph look like? • What is the domain? • What is the range? • Why? • Think about inverses…
5.4 Logarithmic Functions and Their Properties Rewrite the following Logarithms Word Problem!! Use an algebraic method to find how long it would take a town with a population of 50,000, increasing continuously at the rate of 2.5% yearly, to reach a population of 100,000.
5.5 Graphs of Logarithmic Functions Graphing Logarithms Prove it! • In order to graph a logarithm in your calculator, you must use the change of base formula:
5.5 Graphs of Logarithmic Functions Transitions Graph the following Logarithms State the transitions and/or reflections that occur and the domain and range. • The graph of any logarithmic function of the form y = alogb(cx + d) + kcan be obtained by applying geometric transformations to the graph of y = logbx