Download
1 / 42
420 likes | 512 Views
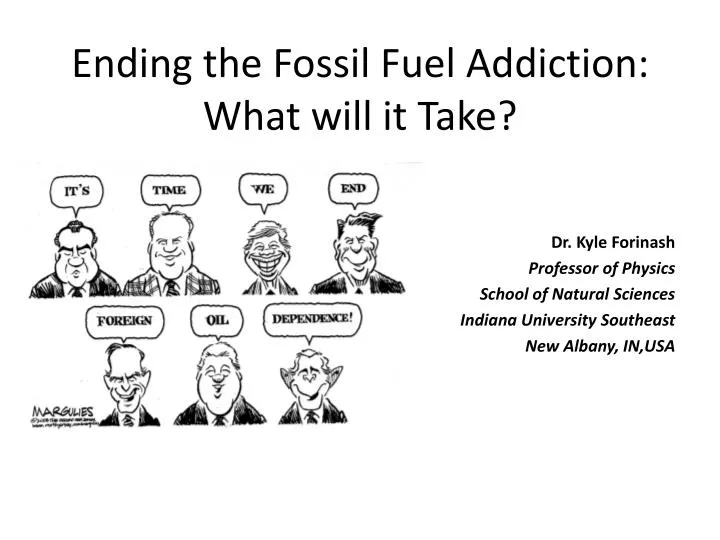
Dr. Kyle Forinash Professor of Physics School of Natural Sciences Indiana University Southeast New Albany, IN,USA. Ending the Fossil Fuel Addiction: What will it Take?. How Much Fossil Fuel Is There?.

E N D
Dr. Kyle Forinash Professor of Physics School of Natural Sciences Indiana University Southeast New Albany, IN,USA Ending the Fossil Fuel Addiction: What will it Take?
In 1956 M. King Hubbert predicted that US oil production would peak in the early 1970s. Excerpt from Hubbert's original paper: Actual:
-(t-tm)2/22 N(t) = Nme QT Nm = √2 +∞ QT = N(t) dt Hubbert initially assumed bell shape curves and fit the data by hand. Ouch! -∞ • Input parameters: • Current consumption, N(t) at year t. • Cumulative consumption up to year t. • Total reserves.
Easier Hubbert Analysis. = Cumulative Production at timet = Production = Total Resource = Growth Rate or A straight Line!
The Earth is Warming. Alaska: Face of Glacier in 2001 Alaska: Face of Glacier in 1951
Won’t Conservation Hurt? • Two Examples: • Refrigerators since 1970: • Increase in efficiency by 75% • Drop in price by 60% • Increase in volume by 20% on average • European and Japanese cars compete well with American cars but use less gas.
Technology of the Past 20 Years Has Been Used to Make Cars 9% Bigger with 40% More HP.
The 2nd Law of Thermodynamics Limits Thermal Engine Efficiencies. ProcessConversionTypeEfficiency Large Electric Generator Mechanical to Electrical 98-99% Large Electric Motor Electrical to Mechanical 90-97% Home Gas Furnace Chemical to Thermal 90-96% Small Electric Motor Electrical to Mechanical 60-75% Fuel Cell Chemical to Electrical 50-60% Large Steam Turbine Thermal to Mechanical 40-45% Diesel Engine Thermal to Mechanical 30-35% Gasoline Engine Thermal to Mechanical 15-25% Florescent Lights Electrical to Radiative 15-25% Incandescent Lights Electrical to Radiative 2-5% Plant Photosynthesis Radiative to Chemical 1%
Where Does Your $1 of Gas Go? 4% idling loss 3% transmission loss 74% heat loss 3% acceleration 3% accessories 6% rolling friction 7% air drag
Transportation Accounts for 28% of the Energy Used in the U.S.
Gasoline Will be Hard to Replace. FuelEnergy per Weight (MJ/kg) Hydrogen 114 (10 liquid; 5 compressed gas) Gasoline 48 Plant Oil (Bio-Diesel) 38 Ethanol 28 Common Coal 22 Natural Gas (STP) 20 Air Dried Wood 15 Potatoes 4 Carbon Fiber Flywheel 0.8 Fruits and Vegetables 0.6 - 1.8 Lithium Batteries (at 400C) 0.2 Lead Batteries 0.1
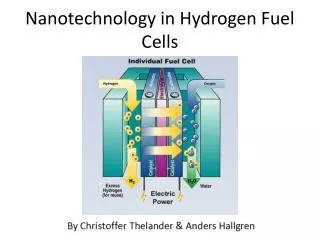
Problems with Hydrogen As a Car Fuel. • H2 is not a fuel (requires energy to make). • H2 is more difficult to transport and more dangerous than diesel, gasoline, propane or natural gas. (Transportation of propane is highly restricted.) • H2 will require a new distribution grid (compared to existing electric grid). • 40% energy loss to make H2 from natural gas. • 80% energy loss to make H2 from grid electricity.
Plant Oil as a Fuel? • US transportation consumption (2004): 27.8 Quad • Energy production, all arable land in the US cultivated with soybeans (bio-diesel): 25.6 Quad
Rail is 4× more efficient than trucks for freight. Rail is 12× more efficient than cars for passengers.
Available Renewable Energy. (*food crops, grassy and woody plants, residues from agriculture or forestry, organic component of municipal and industrial wastes, fumes from landfills)
Land area needed to supply all energy used, 2005, with solar* or wind†.(*20% efficiency solar cell, 50% storage and transmission loss.)(†50MW farm, 30% load factor)
Nuclear Choices. • Death and cancer rates much lower for nuclear than coal, oil or natural gas use per kWh. • France gets ~75% of electricity from nuclear (19.6% for the US, 17% for world in 2003). • 'Inherently safe' reactors (pebble bed, modular design, few moving parts, smaller). • The radioactive waste problem (vitrification, fuel recycling). • Fusion: First reactor by 2050?
Conclusion: There is no silver bullet. • Use of oil is going to decline; coal & shale oil will last a while longer (but CO2 is a problem). • Hydrogen, plant fuel are probably not good ideas. • Conservation should play a big role. • Use of renewables should be increased: wind, biomass, hydroelectric, and especially solar. • Use of electric power should be increased where possible because of higher efficiency. • Nuclear power may be a necessary evil. • New sources? Methane hydrates?
Interesting Activities. • EIA web site http://www.eia.doe.gov/ • Oak Ridge Climate Data (CDIAC) http://cdiac.ornl.gov/ • Gapminder (Google) http://www.gapminder.org/ • Argonne Nat. Lab well to wheels energy spreadsheet http://www.transportation.anl.gov/modeling_simulation/GREET/index.html • Educational Climate Model; EdGCMhttp://edgcm.columbia.edu/
Kyle Forinash Indiana University Southeast http://homepages.ius.edu/kforinas/Forinash.html Island Press, April 2010