Download
1 / 45
470 likes | 635 Views
Environmental. Physics. ORIGIN AND COMPOSITION OF THE ATMOSPHERE. 5 ·10 9 years. Environmental. Physics. THE BIRTH OF THE EARTH: ACCRETION OF PLANETESIMALS.

E N D
Environmental Physics ORIGIN AND COMPOSITION OF THE ATMOSPHERE
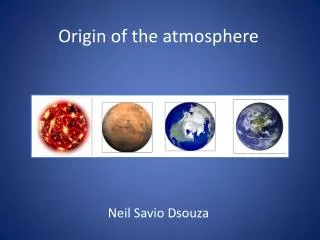
5·109 years Environmental Physics THE BIRTH OF THE EARTH: ACCRETION OF PLANETESIMALS Planetesimals are objects of some Km of diameters that are thought to have formed during the solar system's formation.The origin of the Solar System has been tracked by Safronov's theory about 5 billion years ago, when an initial primordial nebula made of gas (mostly hydrogen and helium) and very diffuse dust grains (carbon and silicate) started to collapse gravitationally leading to the formation of a central protostar and of a surrounding, rotating disk structure, made from the material that was not incorporated in the protostar. During this disk phase (that can last up to 100 millions years), the grains of dust grow in size very rapidly (this phenomenon being called accretion) until, after a relatively short period, they form planetesimals. These planetseimals have a composition that depends on the region where they have formed (we find rocky planetesimals in the inner parts and ices in the outer parts) and are the "bricks" of the following formation of the planets. In fact in the last phase, the accretion of planets is possible, due to the impacts between planetesimals that can glue together, forming growing objects with a composition that is still respected by the actual structure of the solar system (where, in the inner parts, wet find rocky planets, while in the outer parts, planets are gaseous). Asteroids and comets are leftover planetesimals that have not been incorporated into a planet during this period. http://www.ecology.com/archived-links/planetesimals/
Environmental Inner core Solid, radius 1200 km External core Líquid, radius 3470 km Mantle Radius 3470 km Physics Crust Thickness 8 - 70 km THE INNER STRUCTURE OF THE EARTH Structural diferentiation according to the density of different materials Main component: Iron Main component: Iron Iron, magnesium, aluminium, silicon and oxigen Sodium and aluminium silicate minerals Adapted from: http://zebu.uoregon.edu/internet/images/earthstruc.gif http://www.seismo.unr.edu/ftp/pub/louie/class/100/interior.html
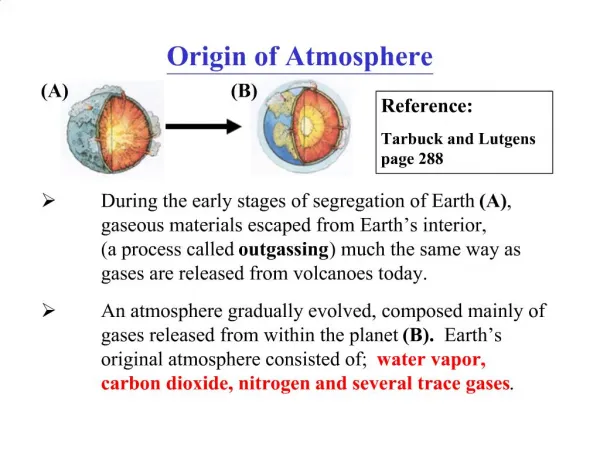
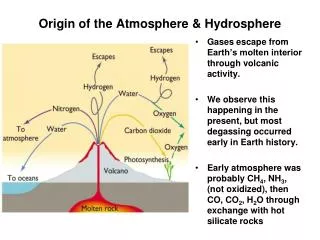
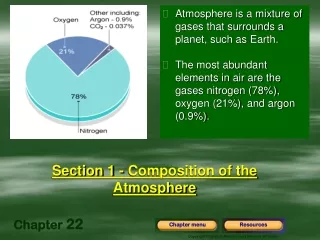
Environmental Physics THE ORIGIN OF OUR ATMOSPHERE Originally formed by volatile compounds from volcanism at the earlier period of the Earth’s story. The gasses were kept back by gravity force. Since then, its composition undergone important variations because several physical, geological and biological processes. Actual volcanic eruptions have a mean composition of 85% H2O, 10% CO2 and SO2 and nitrogen compounds (the rest). Low percentage of H2O in the actual atmosphere Low percentage of CO2 in the actual atmosphere Predominance of nitrogen We have to explain… Presence of other components of low concentration Presence of an important fraction of O2 http://www.xtec.es/~rmolins1/solar/es/planeta02.htm
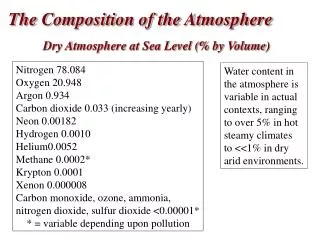
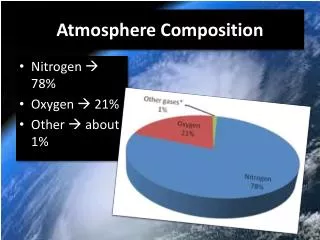
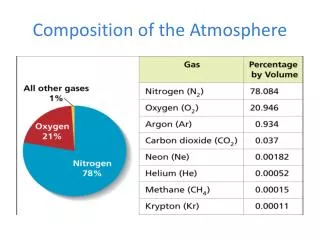
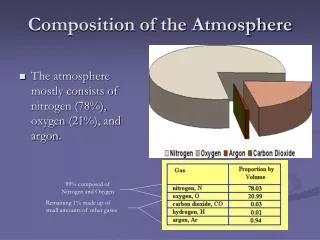
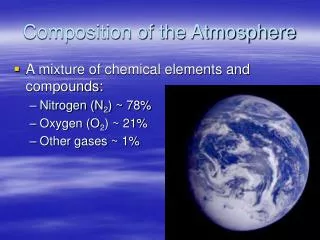
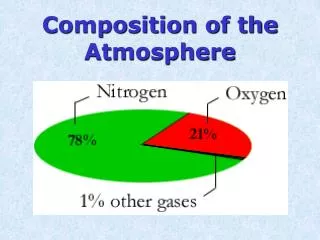
Dry air (majority components) Environmental Dry air (majority component) (% mass) Physics COMPOSITION OF THE ATMOSPHERE Composition below 100 km (percentages) Water steam: Until 4% (volum) Adaptad from John M. Wallace y Peter V. Hobbs, Atmospheric Science: an introductory survey. Academic Press
Environmental Physics COMPOSITION OF THE ATMOSPHERE (CONTINUED) (parts per million) Minority components Ozone: 0-12 ppm
Low contents of water in the actual atmosphere P mb 40 Environmental 30 Room conditions 23 mb 20 10 º C 10 20 30 PC 1 atm P3 Physics T T3 TC 100 C WATER IN THE ATMOSPHERE Both axis have not the same scale T3= 0.01 C = 273.16 K P3= 0.006112 bar TC = 374.15 C = 647.30 K PC = 221.20 bar
Low atmospheric contents in water Environmental Limited ability to keep water steam in the air Saturation and condensation Precipitation and formation of the oceans Hydrosphere Interdependence of the system atmosphere / hydrosphere Physics http://matap.dmae.upm.es/Astrobiologia/Curso_online_UPC/capitulo11/3.html WATER IN THE ATMOSPHERE (CONTINUED)
Océano 97% Hielo 2.4% Environmental Oceans 97 % Ice 2,4 % Subsuelo 97% Subsoil 0,6 % Otros 0.6% Rivers & lakes 0,02 % Ríos y lagos 3,3% Atmosphere 0,001 % Atmósfera 1,7% How to explain this shortfall? Physics HYDROSPHERE Mass 1.36·1021 kg The actual water content of the hydrosphere is two magnitude orders LOWER than that have been injected into from the origin ot the Earth * Filtration at subduction points * UV fotodisociation
Environmental Physics http://geology.er.usgs.gov/eastern/plates.html The earth's surface is broken into seven large and many small moving plates. These plates, each about 50 miles thick, move relative to one another an average of a few inches a year. At convergent boundaries, plates move toward each other and collide. Where an oceanic plate collides with a continental plate, the oceanic plate tips down and slides beneath the continental plate forming a deep ocean trench (long, narrow, deep basin.) An example of this type of movement, called subduction, occurs at the boundary between the oceanic Nazca Plate and the continental South American Plate. Where continental plates collide, they form major mountain systems such as the Himalayas.
Subduction (oceanic trench) Environmental Physics HYDROSPHERE. SUBDUCTION Ocean Oceanic crust Continental crust Upper mantle Filtrations towards the mantle
Fotodisociation O O O O Environmental 104º H H H H H H H H Physics HYDROSPHERE. WATER FOTODISOCIATION Molecule of water High atmosphere, low pressure conditions UV high energy photons High energy photons arise highly reactive free radicals, which recombinate as new chemical species. Specially hidrogen tends to run away because its low molecular mass.
Low rate of carbon dioxide Estimation of carbon content in the Earth crust Storing of carbon: * Rocks, salts, fossil oils * Atmosphere (free CO2) and ocean (solved CO2 * Biosphere Environmental (relative units) Physics CARBON DIOXIDE IN THE ATMOSPHERE Geological and biological porcesses Marine biosphere 1 Continental biosphere 1 Atmosphere (CO2) 70 Ocean (solved CO2) 4000 Fossil oils 800 Salts 800000 Carbonates 2000000 Source: John M. Wallace y Peter V. Hobbs, Atmospheric Science: an introductory survey. Academic Press. From P K Weyl, Oceanography. John Wiley & Sons, NY, 1970 Oxigen presence in the crust: * Iron salts, carbonates y bicarbonates Carbonates: arising by ionic exchange reactions (living beings) H2O + CO2 H2CO3 H2CO3 + Ca++ CaCO3 + 2H +
ConcentrationCO2 (ppm) Environmental 335 330 325 320 Año 315 1958 1960 1962 1964 1970 1966 1968 1972 1974 29% Physics HUMAN ACTIVITY AND CO2 ATMOSFERIC CONTENT Data from Mauna Loa observatory (Hawaii). Adapted from John M. Wallace y Peter V. Hobbs, Atmospheric Science: an introductory survey. Concentration increasing from 1750 280 ppm 1750 360 ppm Actual Based on http://zebu.uoregon.edu/1998/es202/l13.html
Atmospheric predominance of N2 Environmental Around 20% fixed as nitrates (biological activity) Other components of the atmosphere Acid rain Sulphates in crust Physics From radiactive desintegrations NITROGEN AND MINORITARY COMPONENTS The nitrogen content has been only slightly changed because its low reactivity SULPHUR: injected by volcanoes NOBLE GASES: He, Ar
2H2O 2H2 + O2 Water disociation (UV) Environmental H2O + CO2 {CH2O} + O2 Photosynthesis (visible light) Increased O2 releasing 4108 years LIFE ON THE SURFACE LIFE IN THE OCEANS Unicelular seaweed releasing O2 2-3109 años Formation O3 Decreasing UV radiation in surface Physics * See Miller’s experiment in http://matap.dmae.upm.es/Astrobiologia/Curso_online_UPC/capitulo9/4.html OXIGEN O2 PRESENCE IN THE ATMOSPHERE AS A CONSEQUENCE OF BIOLOGICAL PROCESSES SOURCES OF THE ATMOSPHERIC OXIGEN Earlier living beings (reducing environment) * 4109 años
Environmental z Vertical variation >> horizontal variation Physics ATMOSPHERIC PRESSURE Fluids equation: The air density decreases as height increses Below 100 km, for every height from the ground, pressure lies within an interval of 30% of a standard value.
Environmental z Physics It depends on the molecular mass of the gas ATMOSPHERIC PRESSURE (CONTINUED) Air is a compressible fluid Density and pressure are proportional
ATMOSPHERIC PRESSURE (EXAMPLE) Mount Everest is the highest mountain in the Earth (8848 m). Explain which calculations may be performed to obtain the pressure on its top. Compare this pressure with the pressure in the seabed at 8848 m depth. Assume conditions of constant temperature. Data: Air density: 1.225 kg/m3; marine water density: 1030 kg/m3. Pressure and density are proportional Ground level: Hence we estimate a value for B: Ground level standard pressure Remember that... From standard atmosphere calculator: P = 314.4 mb http://www.digitaldutch.com/atmoscalc/
ATMOSPHERIC PRESSURE (EXAMPLE CONTINUED) Mount Everest is the highest mountain in the Earth (8848 m). Explain which calculations may be performed to obtain the pressure on its top. Compare this pressure with the pressure in the seabed at 8848 m depth. Assume conditions of constant temperature. Data: Air density: 1.225 kg/m3; marine water density: 1030 kg/m3. Calculus from standard atmosphere z given in km, T given in K Our calculus:
Standard atmosphere Exponential dropping ATMOSPHERIC PRESSURE (EXAMPLE CONTINUED) Mount Everest is the highest mountain in the Earth (8848 m). Explain which calculations may be performed to obtain the pressure on its top. Compare this pressure with the pressure in the seabed at 8848 m depth. Assume conditions of constant temperature. Data: Air density: 1.225 kg/m3; marine water density: 1030 kg/m3.
Environmental 8848 m Physics Oceanic trench -8848 m ATMOSPHERIC PRESSURE (EXAMPLE CONTINUED) Mount Everest is the highest mountain in the Earth (8848 m). Explain which calculations may be performed to obtain the pressure on its top. Compare this pressure with the pressure in the seabed at 8848 m depth. Assume conditions of constant temperature. Data: Air density: 1.225 kg/m3; marine water density: 1030 kg/m3. Comparison: pressure on the Everest top and pressure on the bottom of the sea Everest top Pressure on the top P = 314.4 mb (from standard atmosphere) P = 354.8 mb (from our calculus) The pressure exerted by a water column of height z is Pressure on the bottom
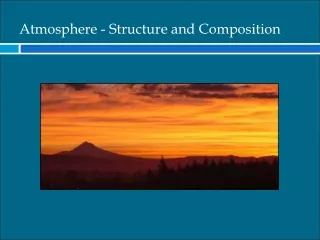
Environmental 1% rest MESOPAUSE 99% rest ESTRATOPAUSE Very dry, O3 main concentration zone High times of permanence of particles Vertical mixture is scarce 99.9% mass TROPOPAUSE grad T -7 K·km-1 Physics 80% mass, 100% water steam Short times of permanence of particles ATMOSPHERIC LAYERS Charged and non-charged particles Scarce collisions Termosphere 80 km Charged particles (ionosphere) Mesosphere 50 km Estratosphere 10 - 12 km Troposphere
Environmental Physics TROPOPAUSE HEIGHT Factors affecting the height of the tropopause Estratosphere * Latitude Over the equator the tropopause lies higher than upon the poles * The season of the year Troposphere * Temperature in troposphere When temperature is low, the tropopause goes down because the convection decreases. Graphics obtained using yearly mean data from http://www-das.uwyo.edu/~geerts/cwx/notes/chap01/tropo.html Additional information: Map of tropopause pressures (mean values 1983-1998) http://www.gfdl.noaa.gov/~tjr/TROPO/TROPO.html
Environmental Physics STANDARD ATMOSPHERE • Air temperatura at height 0 (sea level) is 15 ºC (288.15 K) • Air pressure at height 0 is 1013.25 hPa • Atmospheric air is considered as dry air and it behaves as an ideal gas • Gravity acceleration is constant and its value is 980.665 cm/s2 • From sea level until 11 km the temperature decreases as height increases at a rate of 6.5 ºC/km: T = 288.15 K -( 6.5 K/km)· H (H: height in km) • Throughout this layer pressure is calculated by P = 1013.25 hPa ·(288.15 K/T)^-5.256 • From 11 to 20 km the temperature remains constant: 216.65 K • Throughout this layer pressure is calculated by P = 226.32 hPa · exp(-0,1577·(H-11km)) • From 20 to 32 km the temperature increases: T = 216.65 K + (H-20 km) (H: height in km) • Throughout this layer pressure is calculated by • P = 54.75 hPa·(216.65K/T)^34.16319
Environmental Physics STANDARD ATMOSPHERE (CONTINUED) • From 32 to 47 km the temperature increases as height increases: • T = 228.65 K + (2.8 K/km)·(H-32 km) (H: height in km) • Throughout this layer pressure is calculated by • P = 8.68 hPa · (228.65 K/T)^12.2011 • From 47 to 51 km the temperature remains constant at 270.65 K • Throughout this layer pressure is calculated by • P = 1.109 hPa · exp(-0,1262·(H-47km)) • The rest of upper levels can be obtained from the following references: A. Naya (Meteorología Superior en Espasa-Calpe); y, R.B.Stull (Meteorology for Scientists and Engineers)). Source: J. Almorox, http://www.eda.etsia.upm.es/climatologia/Presion/atmosferaestandar.htm Standard atmosphere calculator: (until 86 km): http://www.digitaldutch.com/atmoscalc/
160 Environmental Height (km) 140 120 Pressure (mb) 100 Liquid water at room conditions 106 g/m3 Density (g/m3) 80 Mean free path (m) 60 40 Mean path a molecule goes over before colliding another Physics 20 10-8 10-7 10-6 10-5 10-4 10-3 10-2 10-1 102 103 1 10 Graphic according with data from John M. Wallace y Peter V. Hobbs, Atmospheric Science: an introductory survey. Academic Press Adapted from CRC Handbook of Chemistry and Physics, 54th Edition. CRC Press (1973) STANDARD ATMOSPHERE. PRESSURE PROFILE
520 510 500 Environmental TERMOPAUSE 490 160 150 We live here! 140 130 120 110 100 90 Height 80 70 60 Physics 50 40 30 20 10 -100 -50 0 50 100 150 200 500/1500 STANDARD ATMOSPHERE. TEMPERATURE PROFILE Temperature of termosphere is highly dependent on sun activity. It may vary from 500 ºC to 1500 ºC. Exosphere TERMOPAUSE Termosphere (km) MESOPAUSE Mesosphere STRATOPAUSE Stratosphere TROPOPAUSE Troposphere Temperature (ºC) Graphics from data in http://www.windows.ucar.edu/tour/link=/earth/images/profile_jpg_image.html
Environmental Height Physics Higher M, Higher B Lower M, lower B P ATMOSPHERE COMPOSITION AS A FUNCTION OF HEIGHT The atmosphere composition varies as the height increases because the following reasons: 1. Diffusion by aleatory molecular movements Diffusion tends to yield an atmosphere in which the mean molecular mass of the mixture components decreases as height increases. Each gas behaves in the same way as whether it were the only component in the mixture (ideal behaviour), and the density of each decreases exponentially as height increases. However the reference height H is different for each gas, and so the gasses having lower molecular mass are most abundant at the upper levels, because the density of the lighter gasses drops slower than that of the heavier gasses. Could you demonstrate that really higher M implies higher B? Higher H Lower H
Environmental Mean free path vs height 160 km 140 120 100 80 Physics 60 40 20 m 10-8 10-7 10-6 10-5 10-4 10-3 10-2 10-1 102 103 1 10 ATMOSPHERE COMPOSITION AS A FUNCTION OF HEIGHT (CONTINUED) 2. Mixture for convection Convection tends to homogenize the composition of the atmosphere. At low levels the mean free path is very small, so the time required for pulling apart different components is much larger than the time the turbulences take for arising a homogeneous mixture. As a consequence, at low levels the atmosphere is a system well stirred whose components are very well mixed. The limit is about 100 km Above 100 km the mixture by convection is no longer as efficient as it was below, and it appears a difference in composition depending on the height.
Boltzmann constant T: Absolute temperature k = 1.38·10-23 J K-1 m: Mass of the hidrogen atom Environmental M: Molecular weight of a particular gas species Temperature at 500 km is 600 ºC Most probable velocity 3 kms-1 Fraction of molecules with velocity equal to escape velocity Physics 10 -6 Most probable velocity Hidrogen 3 kms-1 Oxigen 0.8 kms-1 10 -84 LOSE OF GASSES FROM THE ATMOSPHERE Most probable velocity: Escape velocity: that velocity in what the kinetic energy of a particle is big enough to run away towards the infinitum. ( At a height of 500 km, the escape velocity from the Earth is about 11 kms-1) The lighter gasses did escape along the geological eras, so its actual abundance is low http://www.iitap.iastate.edu/gccourse/chem/evol/evol_lecture.html
Environmental Pressure is a scalar magnitude 1016 1020 1024 Physics -grad P WIND Wind is the moving air from one place to another over the Earth surface. The air flux is related (among other causes) with pressure differences. The change in pressure measured across a given distance is called a pressure gradient. Pressure gradient + GRADIENT DIRECTION: THAT OF FASTER VARIATION OF THE SCALAR MAGNITUDE Blue arrows indicate the sense opposite to that of the gradient pressure The air tends to move against the pressure gradient Do we conclude that wind moves as the blue arrows show? GRADIENT SENSE: TOWARDS HIGHER VALUES OF THE MAGNITUDE NO! …we need also consider the rotation of the Earth!
Environmental Centripetal force Coriolis North Pole Acceleration measured in a rotating reference frame Acceleration measured in an inertial reference frame Trajectory within an inertial reference frame Physics Trajectory within an accelerating reference frame Within an rotating reference frame a Coriolis force proportional to appears, beeing responsible for the observed deviation EARTH ROTATION EFFECTS
Sense of the movement NORTHERN HEMISPHERE Environmental Coriolis deviation SOUTHERN HEMISPHERE Coriolis deviation Physics Sense of the movement CORIOLIS DEVIATION Seen from a point over the surface N Deviation on the right-hand side respect the sense of the movement S Deviation on the left-hand siderespect the sense of the movement
Environmental Pressure gradient B Physics Coriolis force, proportional to Gradient force A -grad P GEOSTROPHIC WINDS Remember: if the Earth would not spin around its polar axis, the movement of the air masses will occur in the opposite sense to that the pressure gradient. Geostrophic winds: winds balanced by the Coriolis and Pressure Gradient forces Northern hemisphere B … and so on, up to the situation is… A http://ww2010.atmos.uiuc.edu/(Gh)/guides/mtr/fw/geos.rxml …geostrophic winds blowing parallel to isobars
Environmental Physics ANTICYCLONES AND STORMS Northern hemisphere: The Coriolis force arises deviation to the right L Within an anticyclone (H) the winds turn clockwise Within a storm (L) the winds turn anticlockwise H Southern hemisphere: The Coriolis force arises deviation to the left Within an anticyclone (H) the winds turn anticlockwise H L Within a storm (L) the winds turn clockwise
Polar cell 1 Intertropical convergence zone Environmental Ferrell cell 2 Hadley cell 3 Physics ATMOSPHERIC GENERAL FLOW Simple model Air going down on the poles (cold areas) and air ascending on the equator (warm areas) THIS SIMPLE MODEL HAVEN’T IN MIND THE EARTH’S ROTATION http://www.newmediastudio.org/DataDiscovery/Hurr_ED_Center/Easterly_Waves/Trade_Winds/Trade_Winds.html
Environmental Physics ATMOSPHERIC GENERAL FLOW (CONTINUED)
Polar Arctic Circle Environmental Polar Antarctic Circle Physics Relationship with the ozone hole over Antarctica WESTERN WINDS NEAR POLAR ZONES ARCTIC ANTARCTIC
Environmental Physics PLANETARY BOUNDARY LAYER Transport phenomena within PBL are related with turbulence Troposphere The planetary boundary layer (PBL) is the atmospheric region, nearest the Earth surface (300-3000 m thickness), where it occurs the most of exchanges of energy and matter. It is the zone where the interaction surface-atmosphere occurs.
Turbulence: whirlpools arising from several causes Environmental 10000 1000 BASE OF THE CLOUDS EXTERN LAYER 100 Height (magnitude order, m) TROPOSPHERE LIMIT LAYER (PBL) 10 SURFACE ROUGHNESS SURFACE LAYER ROUGHNESS LAYER Physics 1 PLANETARY BOUNDARY LAYER (CONTINUED) The planetary boundary layer is the part of the troposhpere directly influenced by the Earth surface. It is able to answer to the stimulation by surface forces wihin a temporal scale of 1 hour or less. TROPOPAUSE The forces associated with the Earth’s surface include drag friction, heat transfer, evaporation and transpiration, contaminant releasing and ground features able to modify the air flux.
Puesta de Sol PBL increasing thickness Environmental Typical values at the end of the evening 1 km (0.2 km - 5 km) PBL thickness dropping Physics 1 km (0.2 km-5 km) 100 m (20 m - 500 m) DAILY VARIATION OF THE PBL PBL stirring Surface warming Sunrise Turbulence drops or disappears Typical values 100 m (20 m - 500 m) Sunset Night begins Surface cooling Wind, temperature and other properties of the PBL undergo fewer daily variations over vast water surfaces as oceans and great lakes than those over lands. This is because the greater specific heat of water.
Height 05:00 08:00 10:00 12:00 15:00 30 cm 60 cm 1.20 m 10.0 m 2.40 m 18:00 15 cm -2 cm -5 cm -15 cm T (ºC) 45 40 35 30 50 TEMPERATURE DAILY CYCLE Typical summer profiles (land) (data: July and August mean, based on A. H. Strahler, Geografía Física)
Atmosphere Precipitation Física 99·1012 m3/ year Evaporation & transpiration Land 361·1012 m3/ year Evaporation 324·1012 m3/ year 62·1012 m3/ year Precipitation Ambiental Undergraound and surface water 423·1012 m3/year 37·1012 m3/ year Oceans 423·1012 m3/ year WATER CYCLE ATMOSPHERIC BUDGET 13·1012 m3 361·1012 m3/year 33.6·1015 m3 62·1012 m3/year 324·1012 m3/ year 99·1012 m3/ year 1350·1015 m3 Based on http://ww2010.atmos.uiuc.edu/(Gh)/guides/mtr/hyd/bdgt.rxml
S. Pal Arya, Introduction to Micrometeorology, 2th Edition. University Press. Roland B. Stull, An Introduction to Boundary Layer Meteorology, Kluwer Academic Publishers Coriolis acceleration http://zebu.uoregon.edu/~js/glossary/coriolis_effect.html http://ww2010.atmos.uiuc.edu/(Gh)/guides/mtr/fw/crls.rxml Anticyclons http://vppx134.vp.ehu.es/met/html/diccio/anticicl.htm Storms http://vppx134.vp.ehu.es/met/html/diccio/borrasca.htm http://www.rc-soar.com/tech/thermals.htm http://f4bscale.worldonline.co.uk/Thermals.htm