Download
1 / 18
180 likes | 194 Views
Malnutrition: Definition, Prevalence, Outcomes, and Cost. What is Malnutrition?. Malnutrition = “undernutrition” Inadequate intake of energy, protein and other nutrients Obese malnourished: excess fat stores but micronutrient or macronutrient (typically protein) malnourished

E N D
What is Malnutrition? Malnutrition = “undernutrition” • Inadequate intake of energy, protein and other nutrients • Obese malnourished: excess fat stores but micronutrient or macronutrient (typically protein) malnourished • Sustained inadequate intake leads to functional changein tissues of the body e.g. muscle loss, weakness, immune function, capacity for recovery, cognition • Responds to re-feeding • Inflammation (disease) can influence response to re-feeding CMTF website adapted from: AW McKinlay: Malnutrition: the spectre at the feast. J RColl Physicians Edinb 2008:38317–21.
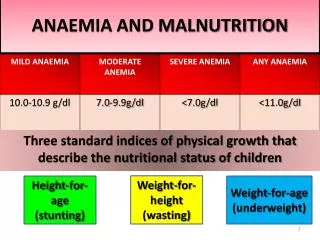
Diagnosing Malnutrition Subjective global assessment (SGA) is the gold standard for diagnosing malnutrition in hospital. Classification: A: Well nourished: no history or physical findings of malnutrition B: Moderately malnourished: Weight loss 5-10% of usual body weight; unintentional weight loss (6 months); mild/moderate signs of malnutrition C: Severely Malnourished: Unintentional weight loss > 10% usual body weight (past 6 months); severe signs of malnutrition *SGA specifically assesses for protein-energy malnutrition and not micronutrient malnutrition
Malnutrition Morbidity Wound healing Infections Complications Convalescence Mortality Treatment Length of Stay COSTS Quality of Life Suffering
Human Costs of Malnutrition Negative outcomes associated with malnutrition • Delayed wound healing • Impaired immunity • Lower quality of life • Impaired function • Increased length of stay, readmission, mortality and/or morbidity rates Correia M.I. Et al: ClinNutr. 2003; 22:235-9.; Covinsky K.E. et al: J Am Geriatr Soc. 2002; 50:631-7.; Middleton M.H. et al:. Intern Med J 2001;31:455-61.; Ferguson M. et al. J Am Diet Assoc 1998;98 (suppl.): A22.Suominen M et al. Eur J ClinNutr 2005; 59: 578-583.; Neumann SA et al. J Hum NutrDietet 2005; 18: 129-136.; Norman K et al. World J Gastroenterol 2006; 12: 3380-3385.; Pauly L et al. Z GerontolGeriatr 2007; 40: 3-12.; Keller H, Can J Rehab 1997; 10(3): 193-204; Keller H, J Nutr Elder 1997;17(2):1-13.
50 PEM non-PEM 40 30 % Mortality 20 10 0 0 1 2 3 4 5 6 7 8 9 Months After Hospitalization Increased Mortality 44% mortality in malnourished patients after 9 months vs. 18% in well-nourished patients PEM: Protein Energy Malnutrition Cederholm T et al. Am J Med. 1995;98:67-74.
The Costs Associated with Malnutrition Malnutrition at admission extends length of stay by ~3 days = $1500-2000 CAD / patient (Curtis et al, 2016) Admitted malnourished patients… • Cost ~60% more than well nourished patients (Braunsweig et al, 2000; Correira et al, 2003) • This cost is independent of disease state (Lim et al., 2012) • Length of stay (LOS) 2-6 day longer (Correira et al., 2003; Kyle et al., 2004; Pirlich et al., 2004) • Developing malnutrition during hospitalization results in even longer LOS ~15 d (Álvarex-Hernández et al., 2012) • 2 x increased risk of readmission in 2 weeks (Lim et al., 2012) • Increased two-year mortality 7 fold (Lim et al., 2012)
Length of Stay and Readmission • Being severely malnourished (SGA C), low hand grip strength (HGS) and reduced food intake during the first week of hospitalization independently predicted a longer length of stay • SGA C and HGS were independent predictors of 30-day readmission Jeejeebhoy KN, 2015 AJCN
Is Treatment Effective? • Generic Oral Nutritional Supplementation(ONS) (Phillipson et al., 2013) • 1.6% of 44 million hospital visits used ONS • ONS use decreased LOS by 21%; ~$ 4734 USD/patient savings • Scoping review: food first interventions (Cheung et al., 2013) • Individualized RD treatment improved intake and health outcomes • protected mealtimes, eating assistance improves food intake • Implementation of guidelines in ICU (Doig et al., 2008; Martin et al., 2004) • Early nutrition support improves outcomes
Malnutrition Research in Canada • The Canadian Malnutrition Task Force (CMTF) conducted the Nutrition Care in Canadian Hospitals (NCCH) cohort study (2010-2013). • The NCCH study provides evidence to support best practice for prevention, identification and treatment of malnutrition in hospitalsfrom 18 hospitals across Canada. • Many of the results shown in this presentation are from the NCCH study.
Hospital Malnutrition in Canada • Almost 1 in 2 medical or surgical patients who stay 2+ days are malnourished at admission (Allard et al., 2015) • Less than ¼ of patients see a dietitian, most of these patients are not malnourished; 75% of malnourished are missed (Keller et al., 2015) • Patients who deteriorate have a longer length of stay (medical 18 days; surgical 12 days) (Allard et al., 2016) • 2/3 of patients leave in the same nutritional state as admitted while 1 in 5 gets worse (Allard et al., 2016)
Hospital Malnutrition in Canada • Poor food intake (≤50% of tray) in the first week of hospital stay occurs for ~35% of patients (Allard et al., 2015) • Poor food intake during admission predicts length of stay when adjusted for other covariates such as malnutrition at admission (Allard et al., 2015) • Patients experience many barriers to intake (Keller et al., 2015) • 42% interrupted during meal • 69% if missed a meal, not provided food • 30% couldn’t open food packages • 20% could not reach meal tray
Prevalence of Malnutrition in Hospital • Reported prevalence of malnutrition among hospitals in North America and Europe: 20% to 60%. • The prevalence of malnutrition at admission is reported at 45% in acute care hospitals in Canada (Allard et al, JPEN 2015). Prevalence based on SGA (Based on Nutrition Care in Canadian Hospitals Study)
What predicts length of stay?(Nutrition Care in Canadian Hospitals Study, Allard et al., JPEN 2015) All of these factors, except a higher hand grip strength, predict a longer length of stay. This means that malnutrition (SGA B/C), taking into account diagnoses, age and other covariates adjusted for in this analysis, predicts length of stay. Food intake regardless of nutritional status also predicts length of staywhen adjusting for covariates including nutritional status. HR > 1.0 characteristic predicted shorter length of stay HR < 1.0 predicted a longer length of stay. Adjusted for: cancer, type of unit, CCI, education, age, RD visit, NPO for 3+ d, preadmission wt loss, BMI at admission
Change in Nutritional Status and Length of Stay (Nutrition Care in Canadian Hospitals Study, Allard et al. ClinNutr 2015)(Admission vs. Discharge n=409 who stayed 7+ days)
Summary • Prevalence of malnutrition in medical and surgical patients who stay 2+ days in Canadian hospitals is 45% • Nutritional status deteriorates in hospital for some • Food intake ≤ 50% and malnutrition are key predictors of length of stay • Malnutrition is costly in human and financial terms • A malnourished patient costs $1500-2000 CAD more • Treatment improves outcomes
Moving Forward… • All health care professionals need to be concerned about the nutritional status of patients • All health care professionals need to… • Become “Food Aware” • Recognize that “Food is Medicine. Medicine Heals.”
Acknowledgements These slides were created and approved by: Heather Keller Celia Laur Bridget Davidson The More-2-Eat Education Group* * Includes input from the UK Need for Nutrition Education/Innovation Programme (NNEdPro) Group This research is funded by Canadian Frailty Network (known previously as Technology Evaluation in the Elderly Network, TVN), supported by Government of Canada through Networks of Centres of Excellence (NCE) Program