Download
1 / 51
510 likes | 654 Views
Lecture 5 : Phylogenies. 9/16/09. Translated blast = protein vs translated database. Blasting Genbank - blastn. Z. bruijni - long beaked echidna T. aculeatus - echidna T. rostratus = honey possum. AX8GS9DG01S. Blasting Genbank - discont megablast - exactly same as blastn.

E N D
Lecture 5 : Phylogenies 9/16/09
Blasting Genbank - blastn Z. bruijni - long beaked echidna T. aculeatus - echidna T. rostratus = honey possum AX8GS9DG01S
Blasting Genbank - discont megablast - exactly same as blastn Z. bruijni - long beaked echidna T. aculeatus - echidna T. rostratus = honey possum AX9N23U7014
Blasting Genbank - megablast - same species but different order Z. bruijni - long beaked echidna T. aculeatus - echidna T. rostratus = honey possum AX9TUM1G016
AX9DYYTE01N Blasting Genbank - Tblastn T. aculeatus - echidna S. brachyurus - quokka S. crassicaudata - fat tailed dunnart M. fasciatus - numbat I. obesulus - quenda
S. brachyurus = quokka I. obesulus = quenda = bandicoot Z. bruijni - Long beaked echidna T. rostratus = honey possum M. fasciatus = numbat S. crassicaudata = fat tailed dunnart Species found by BLAST O. anatinus = platypus T. aculeatus = echidna
Homologene - can be reached from NCBI home page Scroll down - they are listed alphabetically
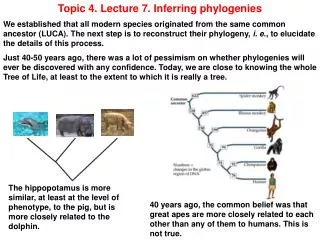
Questions Phylogenies - what are they? • How do we build them? • What do they tell us?
Phylogeny • Evolutionary history of a a group of organisms, especially as depicted in a family tree Haeckel, 1879
Things trees might tell you : • How are organisms with particular trait related? • Did trait evolve multiple times or only once? • What is evolutionary pathway • Of organisms • Of genes
To learn about vertebrate evolution: Compare >600 genes 1998
Used genes to measure time Time since common ancestor with human Time since two groups diverged
More recent version of vertebrate evolution which shows divergence times on the animal tree Ponting 2008
Orangutan Human Chimp Rhesus monkey Mouse Rat Dog Cat Horse Cow Opposum Wallaby Platypus Anole Chicken Frog Fish -Medaka Fugu Tetraodon Zebrafish Elephant shark Lamprey
Primates 25 MY Mammals 100 MY Tetrapods 420 MY Fish 320 MY All vertebrates 550 MY
Molecular clock • Molecules change at a steady rate • We can calibrate how fast they change using fossils • The molecules then become a time piece to measure how recently different groups split off from each other
Sequence conservation may be high • Gene might code for a protein which is highly constrained • Might have to interact with lots of other proteins • Selection might be quite strong
Sequence conservation may be low • Not much constraint • Few sites of interaction • Selection might be weak
Phylogeny steps • Align sequences so homologous AA can be compared • Determine the similarity between sequences • Use this to generate a relationship between sequences
Put sequences in FASTA file >TetraodonG1 MVWDGGIEPNGTEGKNFYIPMSNRTGIVRSPFEYPQYYLVDPIM FKMLALYMFFLICTGTPINGLTLLVTAQNKKLRQPLNYILVNLAVAGLIMCAFGFTIT ITSAINGYFILGATACAVEGFMATLGGEVALWSLVVLAIERYIVVCKPMGSFKFTGTH AAVGVLFTWIMAFACAGPPLFGWSRYLPEGMQCSCGPDYYTLAPGYNNESYVIYMFVV HFFVPVFLIFFTYGSLVLTVRAAAQQQESESTQKAQREVTRMCILMVLGFLVAWTPYA TFSGWIFMNKGAAFHPLTAALCAFFAKSSALYNPVIYVLMNKQFRNCMLSTFGMGGAV DDETSVSASKTEVSSVS >ZebrafishG1 MNGTEGSNFYIPMSNRTGLVRSPYDYTQYYLAEPWKFKALAFYMFLLIIFGFPINVLT LVVTAQHKKLRQPLNYILVNLAFAGTIMVIFGFTVSFYCSLVGYMALGPLGCVMEGFF ATLGGQVALWSLVVLAIERYIVVCKPMGSFKFSANHAMAGIAFTWFMACSCAVPPLFG WSRYLPEGMQTSCGPDYYTLNPEYNNESYVMYMFSCHFCIPVTTIFFTYGSLVCTVKA AAAQQQESESTQKAEREVTRMVILMVLGFLFAWVPYASFAAWIFFNRGAAFSAQAMAV PAFFSKTSAVFNPIIYVLLNKQFRSCMLNTLFCGKSPLGDDESSSVSTSKTEVSSVSPA >CichlidG1 MAWEGGIEPNGTEGKNFYIPMSNRTGIVRSPFEYTQYYLADPIFFKLLAFYMFFLICT GTPINSLTLFVTAQNKKLRQPLNYILVNLAVAGLIMCCFGFTITITSAFNGYFILGST FCAIEGFMATLGGEVALWSLVVLAIERYIVVCKPMGSFKFSGAHAGAGVLFTWIMAMA CAAPPLFGWSRYIPEGMQCSCGPDYYTLAPGFNNESYVIYMFVVHFFVPVFIIFFTYG SLVMTVKAAAAQQQDSASTQKAEKEVTRMCVLMVMGFLIAWTPYASFAGWIFMNKGAS FSALTAAIPAFFAKSSALYNPVIYVLMNKQFRNCMLSTIGMGGMVEDETSVSTSKTEV SSVS
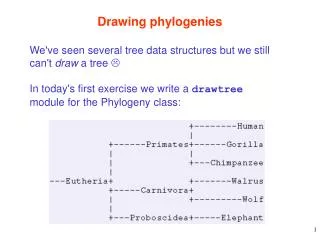
Aligned sequences .aln ; Jalview gives colored version Funky tree .dnd (need special program to draw) Scroll down this page for tree (use Phylogram)
CLUSTAL W (1.83) multiple sequence alignment TetraodonG1 MVWDGGIEPNGTEGKNFYIPMSNRTGIVRSPFEYPQYYLVDPIMFKMLALYMFFLICTGT 60 CichlidG1 MAWEGGIEPNGTEGKNFYIPMSNRTGIVRSPFEYTQYYLADPIFFKLLAFYMFFLICTGT 60 ZebrafishG1 --------MNGTEGSNFYIPMSNRTGLVRSPYDYTQYYLAEPWKFKALAFYMFLLIIFGF 52 *****.***********:****::*.****.:* ** **:***:** * TetraodonG1 PINGLTLLVTAQNKKLRQPLNYILVNLAVAGLIMCAFGFTITITSAINGYFILGATACAV 120 CichlidG1 PINSLTLFVTAQNKKLRQPLNYILVNLAVAGLIMCCFGFTITITSAFNGYFILGSTFCAI 120 ZebrafishG1 PINVLTLVVTAQHKKLRQPLNYILVNLAFAGTIMVIFGFTVSFYCSLVGYMALGPLGCVM 112 *** ***.****:***************.** ** ****::: .:: **: **. *.: TetraodonG1 EGFMATLGGEVALWSLVVLAIERYIVVCKPMGSFKFTGTHAAVGVLFTWIMAFACAGPPL 180 CichlidG1 EGFMATLGGEVALWSLVVLAIERYIVVCKPMGSFKFSGAHAGAGVLFTWIMAMACAAPPL 180 ZebrafishG1 EGFFATLGGQVALWSLVVLAIERYIVVCKPMGSFKFSANHAMAGIAFTWFMACSCAVPPL 172 ***:*****:**************************:. ** .*: ***:** :** *** TetraodonG1 FGWSRYLPEGMQCSCGPDYYTLAPGYNNESYVIYMFVVHFFVPVFLIFFTYGSLVLTVR- 239 CichlidG1 FGWSRYIPEGMQCSCGPDYYTLAPGFNNESYVIYMFVVHFFVPVFIIFFTYGSLVMTVKA 240 ZebrafishG1 FGWSRYLPEGMQTSCGPDYYTLNPEYNNESYVMYMFSCHFCIPVTTIFFTYGSLVCTVKA 232 ******:***** ********* * :******:*** ** :** ********* **: TetraodonG1 AAAQQQESESTQKAQREVTRMCILMVLGFLVAWTPYATFSGWIFMNKGAAFHPLTAALCA 299 CichlidG1 AAAQQQDSASTQKAEKEVTRMCVLMVMGFLIAWTPYASFAGWIFMNKGASFSALTAAIPA 300 ZebrafishG1 AAAQQQESESTQKAEREVTRMVILMVLGFLFAWVPYASFAAWIFFNRGAAFSAQAMAVPA 292 ******:* *****::***** :***:***.**.***:*:.***:*:**:* . : *: * TetraodonG1 FFAKSSALYNPVIYVLMNKQFRNCMLSTFGMGG--AVDDETS-VSASKTEVSSVS-- 351 CichlidG1 FFAKSSALYNPVIYVLMNKQFRNCMLSTIGMGG--MVEDETS-VSTSKTEVSSVS-- 352 ZebrafishG1 FFSKTSAVFNPIIYVLLNKQFRSCMLNTLFCGKSPLGDDESSSVSTSKTEVSSVSPA 349 **:*:**::**:****:*****.***.*: * :**:* **:*********
Alignment is key • Any other analysis that you do is only as good as your alignment • If your alignment is bad subsequent analyses will be bad • Junk in = Junk out
Alignments • Tell you about sequence conservation • How much is there? • Where is it?
Calculate sequence similarities Zebrafish M--------NGTEGSNFYIPMSNR Trout M------Q-NGTEGSNFYIPMSNR Medaka M------E-NGTEGKNFYIPMNNR Cod M----RMEANGTEGKNFYIPMSNR Halibut MVWDGGIEPNGTEGKNFYIPMSNR Tetraodon MVWDGGIEPNGTEGKNFYIPMSNR Goldfish M--------NGTEGNNFYVPLSNR Killifish M---GYG-PNGTEGNNFYIPMSNK * *****.***:*:.*: Pairwise comparisons
Use tree to show sequence relationships Short branches mean sequences are more similar Long branches mean there are more differences
Q3. How do we build phylogenies? • Assume the relationships involve bifurcating branches ATC ATC ATG ATG ACG ACG CCG CCG CCC CCC
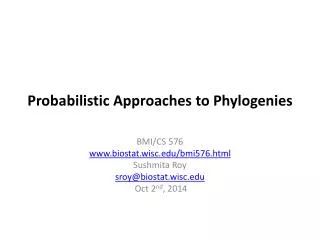
Methods to determine similarities • Parsimony • Distance • Maximum likelihood • Bayesian
Parsimony • The least complex explanation is the most likely to be correct • Occam’s razor • The preferred phylogenetic tree is one that requires fewest changes • Count up # changes for all possible trees • Find the shortest one
CT CT CT Most parsimonious Trees based on parsimony ATCG ATCG ATCG ACCG ACCG ATCG ACCG ACCG
CT CT CT Most parsimonious Trees based on parsimony T T T C C T C C
Can’t always distinguish tree topologies T T CT CT T T C C C C Equally parsimonious
Other limitations • All changes are weighted the same • C-T same as C - A • Same no matter how long it takes for the change to occur
Distance methods • Calculate a numerical value for sequence differences • Do for all pairwise combinations • Build tree by joining most similar sequences and then more divergent
Distance methods • Fast • Pretty robust • Only deals with data in pairs
Pairwise distances • Taxa1 AACGGTCATGGCGTTGCATT • Taxa2 AACGGTCAGGGCGTTGCATT • Taxa3 AACGGTCACGCCGCTGCATT
Distance, d • p is fractional similarity of sequence • Simplest form of distance: d = 1 - p • AACGGTCATGGCGTTGCATT • AACGGTCACGGCGTTGCATT • p = 19/20 d = 0.05
1 2 3 Tree building • Neighbor joining • Join most similar pair of sequences • Add more divergent after
How different can 2 sequences get? • At infinite time, random probability that two sequences are the same • Probability a base is same = 1/4 • DNA only has 4 bases • Certain sites will start to change multiple times • Need to account for these multiple hits
Random sequences • Write down 20 bases of sequence
Compare your sequence to this one • AGTCCGATTACGGCTAGCAG • What fraction of sites are the same in the two sequences?
DNA models • Use different DNA models to account for how sequences evolve with time • Allows you to apply different molecular clocks • Relate sequence change to time • Clock is not linear except for small changes and short times • Models same as used in maximum likelihood methods
How good is your tree? • Bootstrap approach • Run the same method multiple times • Subsample data each time • Use 50% of data • See how reproducible the trees are • Count how many times a particular grouping occurs
Distance tree for rod and cone transducin alpha subunitBranch lengths are proportional to sequence differences