Download
1 / 38
380 likes | 521 Views
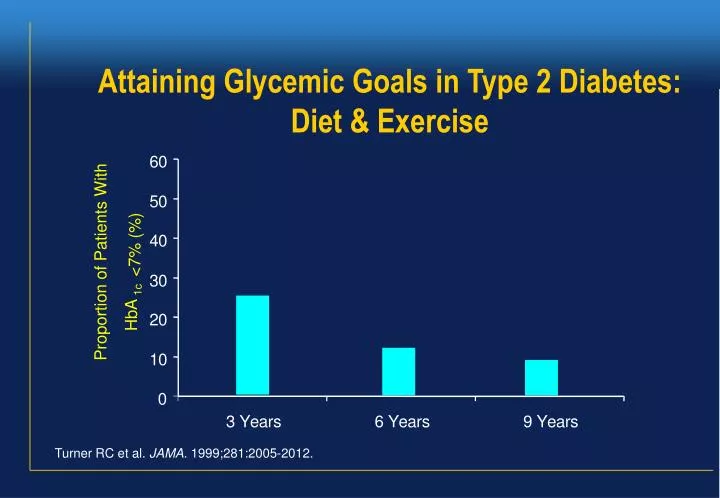
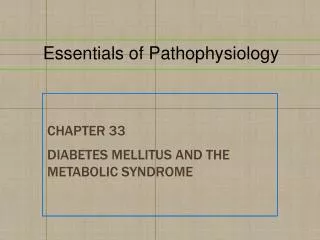
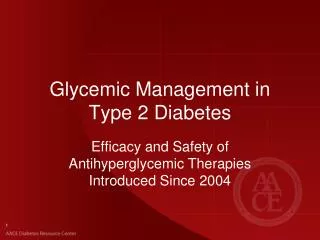
Attaining Glycemic Goals in Type 2 Diabetes: Diet & Exercise. 6. 0. 5. 0. 4. 0. <7% (%). Proportion of Patients With. 3. 0. 1c. 2. 0. HbA. 1. 0. 0. 3. Y. e. a. r. s. 6. Y. e. a. r. s. 9. Y. e. a. r. s. Turner RC et al. JAMA. 1999;281:2005-2012.

E N D
Attaining Glycemic Goals in Type 2 Diabetes:Diet & Exercise 6 0 5 0 4 0 <7% (%) Proportion of Patients With 3 0 1c 2 0 HbA 1 0 0 3 Y e a r s 6 Y e a r s 9 Y e a r s Turner RC et al. JAMA. 1999;281:2005-2012.
Treatment of Type 2 Diabetes -glucosidase inhibitors Thiazolidinediones Intestine: glucose absorption Muscle and adipose tissue: glucose uptake Blood glucose GLP-1 analogs DPP4 inhibitors Sulfonylureas Meglitinides Biguanides Liver: hepatic glucose production Pancreas: insulin secretion
Biguanides:Basic Characteristics of Metformin (Glucophage, Glucomin) Mechanism of action Decreases hepatic glucose production Depends upon Presence of insulin Power Decreases HbA1c 1% to 2% Dosing One to three times daily Side effects Diarrhea, nausea Main risk Lactic acidosis
Insulin Secretagogues:Basic Characteristics of Sulfonylureas and Meglitinides Mechanism of action Increase basal and postprandial insulin secretion Depends upon Functioning -cells Power Decreases HbA1c 1% to 2% Dosing Once or twice daily (sulfonylureas); three times daily (meglitinides) Side effects Weight gain Main risk Hypoglycemia 4-18
Mechanism of Sulfonylurea Induced Insulin Secretion Ca++ K+ Sulfonylureas Depolarization ATP/ADP Carbachol IP3 Krebs Ca++ DAG PKA Glucose-6-P PKC GK (sensor) cAMP Glucose Glucose - + GLUT 2 AC INSULIN & C-PEPTIDE Somatostatin Glucagon GLP-1 Catecholamines
Thiazolidinedione Chemical Structures O CH3 Rosiglitazone (Avandia) N S N O N O O CH3 N H3C O Troglitazone S O CH3 O HO CH3 O Et Pioglitazone N S O N O
PPARg Activation of PPARgamma Alters Expression of Specific Genes retinoic RSG RXR Regulates gene transcription AGGTCA X AGGTCA Gene encoding GLUT-4, lipoprotein lipase, PEPCK, aP2 etc. PPRE (DR-1)
Pancreas Sites of action of Glitazones Carbohydrates Gut Digestive enzymes Glitazones reduces insulin resistance in the liver, muscle and adipose tissue Blood glucose Insulin Adiposetissue Muscle Liver Oakes ND, et al. Diabetes 1994; 43:1203–1210. Young PW, et al. Diabetes 1995; 44:1087–1092.
Rosilitazone Increases Islet Area and Density in Pancreatic Islets of db/db Mice Control Rosiglitazone Scale 100 mm (enlarged view) Pancreatic sections were immunohistochemically stained for insulin Lister et al, Diabetologia 1998; 41 (Supplement 1):A660.
Thiazolidinediones (Glitazones):Basic Characteristics Mechanism of action Enhances muscle and adipose tissue response to insulin Depends upon Presence of insulin and resistance to its action Power Decreases HbA1c 0.5% to 1.3% Dosing Once or twice daily Side effects Edema, weight gain, anemia Main risk Liver failure (only troglitazone?) Data from Henry. Endocrinol Metab Clin. 1997;26:553-573; Gitlin, et al. Ann Intern Med. 1998;129:36-38; Neuschwander-Tetri, et al. Ann Intern Med. 1998;129:38-41; Medical Management of Type 2 Diabetes. 4th ed. Alexandria, Va: American Diabetes Association; 1998:1-139; Fonseca, et al. J Clin Endocrinol Metab. 1998;83:3169-3176.
Placebo GLP-1 Insulin (pmol/L) Glucagon (pmol/L) Glucose (mmol/L) 17.5 350 25 GLP-1/PBO infusion GLP-1/PBO infusion GLP-1/PBO infusion 15.0 300 20 12.5 250 15 10.0 200 * * * * * 7.5 150 * 10 * * * * * 5.0 100 * * * 5 * * * * 2.5 50 * 0.0 0 0 -30 0 60 120 180 240 -30 0 60 120 180 240 -30 0 60 120 180 240 Time (min) Time (min) Time (min) Data are mean ± SE. * P <0.05 Nauck MA, et al. Diabetologia 1993; 36:741-744 Glucose Dependent Actions of GLP-1in Patients With Type 2 Diabetes
"הבה נ- גילה..." GLP-1 analog Exendin-4 (Exenatide) לטאת גילה Gila Monster Eng J, et al. J Biol Chem 1992; 267:7402-7405 Chen YQE and Drucker DJ, J Biol Chem 1997; 272: 4108-4115
9.0 8.5 +0.1% 8.0 * -0.4% Mean (±SE) A1C (%) * 7.5 -0.8% 7.0 Placebo Lead-in 6.5 Screen 0 5 10 15 20 25 30 Time (wk) Met + Placebo Met + 5 µg exenatide Met + 10 µg exenatide ITT, N = 336 (Placebo, n = 113; 5 µg exenatide, n = 110; 10 µg exenatide, n = 113) * P <0.0005 reductions from baseline (pairwise comparison to placebo) in both exenatide arms for Weeks 6 to 30 DeFronzo R, et al. ADA 64th Annual Scientific Sessions, June 2004 Exenatide + Met Study: Effect on A1C
Dipeptidyl Peptidase 4 (DPP-4) C C N N Cell membrane Cytosol • DPP-4 is a serine protease of the prolyl oligopeptidase enzyme family that exists in two forms • Membrane-bound (widely expressed) • Soluble Adapted from Evans DM IDrugs 2002;5:577–585; Drucker DJ Expert Opin Investig Drugs 2003;12:87–100; Rasmussen HB et al Nat Struct Biol 2003;10:19–25.
Incretin release DPP -4 Inhibitor DPP-4 inhibition Increases Active Incretin Level GLP-1 (9-36) GIP (3-42) X DPP-4 ↑GLP-1 (7-36) ↑GIP (1-42) Adapted from Deacon CF et al Diabetes 1995;44:1126–1131; Ahrén B Curr Diab Rep 2003;3:365–372; Deacon CF et al J Clin Endocrinol Metab 1995; 80:952–957; Weber AE J Med Chem 2004;47:4135–4141.
24-week, Monotherapy, Placebo-controlled StudyProportion of Patients Achieving HbA1c <7.0% at Week 24 60 P<0.001 50 40 Patients (% to goal) 30 20 10 0 Placebo (n=244) Sitagliptin 100 mg/day (n=229) Mean baseline values: sitagliptin, 8.01%; placebo, 8.03% All-patients-as-treated population Adapted from Aschner et al. Diabetes Care. 2006;29:2632–2637.
The miracle of insulin 15 February, 1923 Patient J.L., 15 December, 1922
1923: Nobel Prize to Banting and Macleod JB Collip FG Banting JJR Macleod CH Best
Pharmacodynamics of Human Insulins Insulin Onset Peak Duration Preparation Regular 30-60 min 2-4 h 6-10 h NPH/Lente 1-2 h 4-8 h 10-20 h NB: Time-course of action of any insulin may greatly vary between individuals, or at different times in the same individual 6-22
INSULIN TACTICS Once-daily Mixed Insulin Regular NPH Insulin Effect B L S HS B 6-23
INSULIN TACTICS Twice-daily Mixed Insulin Regular NPH Insulin Effect B L S HS B 6-23
INSULIN THERAPYThe Basal/Bolus Insulin Concept • Basal Insulin • Suppresses glucose production between meals and overnight • ~50% of daily needs • Bolus Insulin (Mealtime or Prandial) • Limits hyperglycemia after meals • 10% to 20% of total daily insulin requirement at each meal 6-20
Regular NPH Insulin Effect B L S HS B INSULIN TACTICS Multiple Daily InjectionsNPH + Regular 6-24
INSULIN TACTICSChronic Multiple Daily InjectionsBedtime NPH + Mealtime Regular Insulin 8 weeks Non-DM R R N SerumInsulin R 300 200 pmol/L 100 0 0800 1200 1600 2000 2400 0400 0800 Time of Day Lindström, et al. Diabetes Care. 1992;15:27-34. 6-50
INSULIN TACTICSShorter-acting Insulin Analogues:Lispro & Aspart 400 500 Aspart Lispro 450 350 400 300 350 250 300 Plasma Insulin (pmol/L) 250 200 Plasma Insulin (pmol/L) Regular 200 150 Human 150 Regular 100 100 Human 50 50 0 0 0 30 60 90 120 150 180 210 240 0 50 100 150 200 250 300 Time (min) Time (min) Meal SC injection Meal SC injection Heinemann, et al. Diabet Med. 1996;13:625-629; Mudaliar, et al. Diabetes Care. 1999;22:1501-1506. 6-28
INSULIN TACTICS Insulin Glargine:A New Long-acting Insulin Analogue • Modifications to human insulin chain • Substitution of glycine at position A21 • Addition of 2 arginines at position B30 • Gradual release from injection site • Peakless, long-lasting insulin profile Gly 1 Substitution 5 10 15 20 Asp 1 5 15 20 25 30 10 Extension Arg Arg 6-33
INSULIN TACTICS Glargine vs NPH Insulin in Type 1 DiabetesAction Profiles by Glucose Clamp 6 5 4 NPH Glucose Utilization Rate (mg/kg/h) 3 2 Glargine 1 0 0 10 20 30 Time (h) After SC Injection End of observation period Lepore, et al. Diabetes. 1999;48(suppl 1):A97. 6-34
Insulin detemir 0.1 U/kg Insulin detemir 0.2 U/kg Insulin detemir 0.4 U/kg NPH insulin 0.3 IU/kg Pharmacodynamic action profiles for insulin detemir and NPH insulin in subjects with type 1 diabetes 2.0 1.5 GIR (mg/kg/min) 1.0 0.5 0 0 4 8 12 16 20 24 Time since insulin injection (hours) J Plank et al. Diabetes Care 2005;28(5):1107-12
Intention to Treat — Initiating Insulin and the 4-T Study Graham T. McMahon, M.D., M.M.Sc., and Robert G. Dluhy, M.D. editorial , New England journal of med., 10.1056/nejme078196
Pharmacodynamics of Native & Engineered Human Insulin Preparations Insulin Onset Peak Duration Preparation Lispro/Aspart 5-15 min 1-2 h 4-6 h Human Regular 30-60 min 2-4 h 6-10 h Human NPH/Lente 1-2 h 4-8 h 10-20 h Glargine 1-2 h Flat ~24 h NB: Time-course of action of any insulin may greatly vary between individuals, or at different times in the same individual 6-22
INSULIN TACTICSGlargine at HS + Short Acting Analogs Immediate acting analogs Glargine Insulin Effect B L S HS B
Intensive therapy; n = 67 Conventional therapy; n = 63 P = 0.06 P < 0.001 P = 0.19 P = 0.001 P = 0.21 90 80 70 60 Patients reaching intensive-treatment goals at mean 7.8 year (%) 50 40 30 20 10 0 HbA1c< 6.5% Cholesterol< 175 mg/dl(4.5 mmol/l) Triglycerides< 150 mg/dl(1.7 mmol/l) Systolic BP< 130 mmHg Diastolic BP< 80 mmHg
Multifactorial Intervention and Cardiovascular Disease in Patients with Type 2 Diabetes NEngl J Med 348:383-93, 2003
Islet Transplantation in Type 1 Diabetes Robertson RP, N Engl J Med, 2004


![[Exercise Name]](https://cdn2.slideserve.com/4369850/exercise-name-dt.jpg)