Download
1 / 39
390 likes | 790 Views
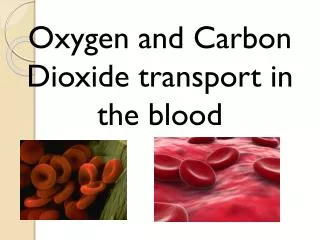
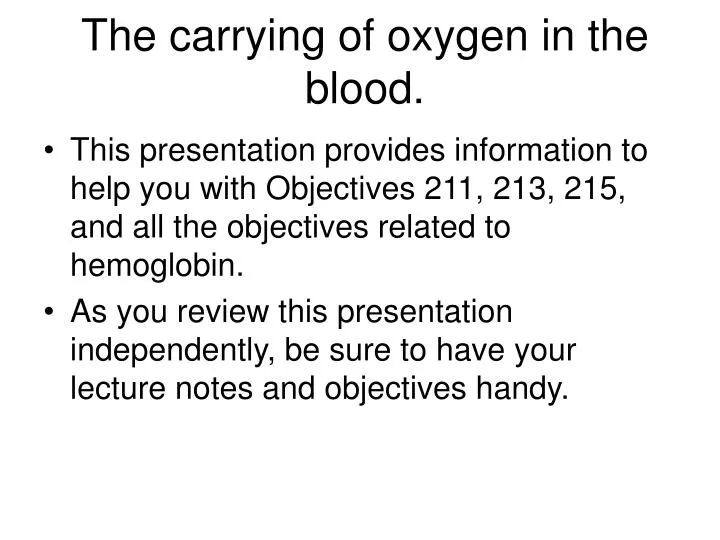
The carrying of oxygen in the blood. This presentation provides information to help you with Objectives 211, 213, 215, and all the objectives related to hemoglobin. As you review this presentation independently, be sure to have your lecture notes and objectives handy.

E N D
The carrying of oxygen in the blood. • This presentation provides information to help you with Objectives 211, 213, 215, and all the objectives related to hemoglobin. • As you review this presentation independently, be sure to have your lecture notes and objectives handy.
1. Fig. 23-20. Why do oxygen and carbon dioxide move in the directions indicated by the arrows? (See Obj. 211.) This figure also helps you to answer Obj. 213.
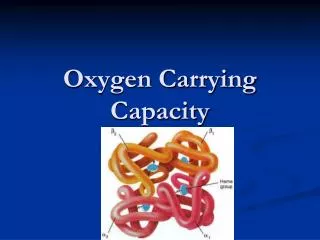
Objective 215 tells you about how much of the oxygen in the blood is carried attached to the hemoglobin molecule. • The next slide shows a picture of hemoglobin.
4. It will help us understand the role of hemoglobin if we know how hemoglobin is studied in the lab.
Fig. 23-21 Oxygen-hemoglobin saturation curve. Look at this table.
7. Choose a Po2 value, go up to the red line, then read across to the value of the % saturation.
8. Look at the numbers in the table and verify that they have been read from the curve.
9. How do we use this curve to understand hemoglobin’s ability to deliver oxygen from the lungs to the tissues? • We need to know the % saturation of hemoglobin in the lungs and in the tissues. • We need to remember that an increase in % saturation means that hemoglobin has picked up O2. (Where did the O2 come from?) • We need to remember that a decrease in % saturation means that hemoglobin has released O2. (Where did the O2 go?)
11. Po2 values • Pulmonary Arteries = 40 mm Hg • Bloodgoesthrough pulmonarycapillaries • Pulmonary Veins =100 mm Hg • Systemic Arteries = 95 mm Hg • Blood goesthroughsystemiccapillaries • Systemic Veins =40 mm Hg
13a. How much of the hemoglobin lost its oxygen in going from systemic arteries to systemic veins?
13b. How much of the hemoglobin lost its oxygen in going from systemic arteries to systemic veins?
14. This means that 22% of the hemoglobin loses its oxygen as it passes from the systemic arteries to the systemic veins. • Where does this oxygen go?
16. This means that oxygen is released to cells when the per cent saturation of hemoglobin decreases. • What does it mean when there is an increase in per cent saturation of hemoglobin? • Where would you expect to see an increasein per cent saturation of hemoglobin?
17. For the answer to these questions, as well as material to help you in Objectives 217-221, you need to go to your lecture notes.
19. Fig. 23-22a shows the effect of changing the pH. Go to your notes to see the effect of changing pCO2 and [BPG].
21. How do these changes affect hemoglobin’s delivery of oxygen between the lungs and the tissues? • Go to your notes to find the answer to this important question.
22. What is myoglobin and what does its saturation look like? • The answers to these questions can be found in your notes. • Also, you will discover the usefulness of myoglobin as an oxygen-carrying molecule.
23. Fig. 23-23 shows the difference between fetal and adult hemoglobin.
24. How does this graph demonstrate hemoglobin’s ability to deliver oxygen from the mother’s blood to the fetus’s blood? • Go to your notes for the answer to this question.